![]()
![]()
|
|
|
|
The A/D oscillator is a "normalized" oscillator.
An A/D oscillator is divided by a number that is a multiple of a period's range. Each period is treated independently. This "normalizes" the study and enables it to adapt to changing trading ranges.
Formula:
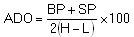
Where:
BP = buying power, or high-open
SP = selling power, or close-low
H = high
L = low
|
Parameter |
Function | ||||||||||||||
|
Color |
Default color is Yellow. To change the color, click on the color button:
Then choose the color you want from the Color Menu.
| ||||||||||||||
|
Graph |
Sets the drawing method for the study.
| ||||||||||||||
|
Line Style |
Sets the rendering technique of the graph parameter (if it is set to Line).
| ||||||||||||||
|
Line Width |
Sets the thickness of the study line.
|
Notes
The signals given by Accumulation/Distribution involve the concepts of divergence and confirmation.
Accumulation/Distribution issues a bullish signal on positive divergence. Beware of weak positive divergence. The object is to identify the dominant trend of the Accumulation/Distribution line. A two-week positive divergence weaker than while a month-long positive divergence. The converse of these principles apply to negative divergence.
The Accumulation/Distribution Line measures the volume force behind a move. As a volume-based study, Accumulation/Distribution helps determine whether instrument volume is increasing on advances or declines. There are several applications of this study:
Gauge money flow. An uptrend indicates prevalent buying while a downtrend indicates prevalent selling.
Identify divergence, positive and negative
Confirm the strength and sustain-ability of a move.
see, Kaufman, P. J., The New Commodity Trading Systems and Methods, New York: John Wiley & Sons, 1987.

