![]()
![]()
|
|
|
|
|
Description |
Chart() enables you to create a chart in memory, and to reference the values of any bar. The current bar has a reference value of -1. | ||||||||||||||||||||||||||||||||
|
|
| ||||||||||||||||||||||||||||||||
|
Syntax |
| ||||||||||||||||||||||||||||||||
|
|
| ||||||||||||||||||||||||||||||||
|
Parameters |
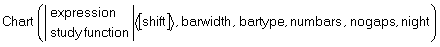
expression An expression must include an instrument symbol. The expression builds the chart using data stored in the Aspen data bases. The instrument symbol is the key to looking up the data you want.
study function Using a study function in the expression creates a chart of the study.
[shift] Optional. Note the brackets are literal. By default, the Chart() function returns the value of the previous bar, which has a reference value of 0. If you want the value of the current bar, you must subscript the expression with a value of -1.
barwidth Defines the number of ticks, minutes, or days per bar. Possible values include:
bartype Defines the type of bar. Possible values are:
numbars Number of bars to compute prior to the current bar (a.k.a. "prefetch"). The default is 0.
nogaps Determines whether .NOGAPS is on or off. Default is on. Settings include:
night Determines what data is used to create the chart in memory. Possible settings include:
| ||||||||||||||||||||||||||||||||
|
|
| ||||||||||||||||||||||||||||||||
|
Return Value |
In chart windows, Chart() renders a study or overlay line. In quote windows, Chart() returns the value referenced in the fill parameter--if the fill parameter omitted, the previous is returned. | ||||||||||||||||||||||||||||||||
|
|
| ||||||||||||||||||||||||||||||||
|
Examples |
CHART_EX1=CHART(SAVG(SERIES,9),1,2,100,1,3[-1])
CHART_EX2=CHART(SAVG(INPUT,9),1,1,60,0,1) | ||||||||||||||||||||||||||||||||
|
|
| ||||||||||||||||||||||||||||||||
|
Comments |
NA |