![]()
![]()
|
|
|
|
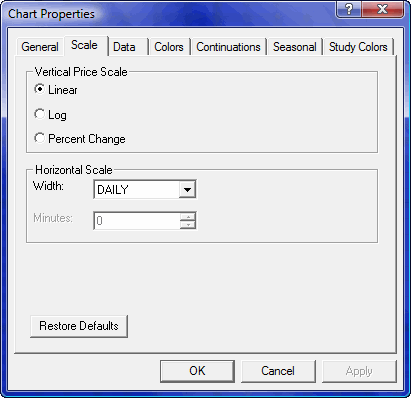
The Vertical Price Scale properties are mutually exclusive (only one can be selected). The radio buttons in this group enable you to adjust the price scale.
|
Property |
Function |
|
Linear |
Linear price scaling is what you are used to seeing in a bar chart. The price scale is set by an instrument's trading units, and the bar plots linearly along the scale.
|
|
Log |
Logarithmic scaling enables you to compare percentage price changes rather than absolute price changes. Plotting prices on a logarithmic scale allows the presentation of a uniform picture of performance and permits the easy comparison of instruments that differ widely in dollar amount.
Logarithmic scaling is most appropriate when comparing long term charts that cover a wide range of price levels.
To change the active chart window to logarithmic scaling, display the Chart Properties dialog's Scale tab and select the Logarithmic check box.
To return the chart to a normal, or linear, scale, display the Chart Properties dialog's Scale tab and select the Linear check box.
|
|
Percent Change |
Percent change charts are used to compare the percent change in price from the close of the left-most bar. Percent change charts are often used to compare the performance of different instruments.
To change the active chart window to percent change scaling, display the Chart Properties dialog’s Scale tab and select the Percent Change check box.
To return the chart to a normal, or linear, scale, display the Chart Properties dialog’s Scale tab and select the Percent Change check box.
When a percent change chart is initially drawn, all percentages are calculated from the left-most bar. To specify a certain bar as your base for percent change, place the cursor on that bar and again re-select Percent Change from the Chart Properties dialog. |
The Horizontal Scale group contains time base properties:
|
Property |
Function | ||||||||||||||||||
|
Width |
The Width field controls which database (tick, 15 minute, or daily) you want to access.
| ||||||||||||||||||
|
Modifier |
Changing the value in the Width property changes the label of this property because this property modifies the Width property.
|
|
Button |
Function |
|
Restore Defaults |
Restores default properties in the this tab.
|
|
OK |
Applies current settings on all tabs and exits this dialog.
|
|
Cancel |
Exits this dialog without applying settings.
|
|
Apply |
Applies current settings and leaves this dialog in view. |
©2008 Aspen Research Group, Ltd. All rights reserved. Terms of Use.