|
|
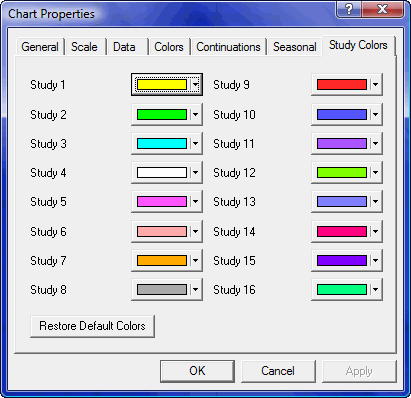
When you display more than one study or instrument on a chart, Aspen Graphics uses colors to differentiate each element. The Study Colors tab defines the colors that charted elements are given. You can modify this scheme by changing the color associated with ordinals 1 through 16. Note that the seventeenth element added reverts to the color associated with Study 1.

|
Button |
Function |
|
Restore Default Colors |
Restores Aspen's default color scheme.
|
|
OK |
Applies current settings on all tabs and exits this dialog.
|
|
Cancel |
Exits this dialog without applying settings.
|
|
Apply |
Applies current settings and leaves this dialog in view. |
©2008 Aspen Research Group, Ltd. All rights reserved. Terms of Use.