![]()
![]()
|
|
|
|
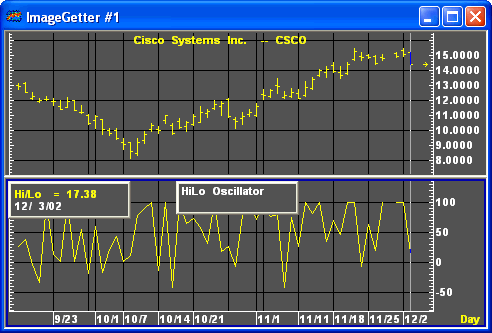
The high/low oscillator uses the range between one period’s high price and the previous period’s closing price as a ratio of the total range in a series of periods.
Formula:
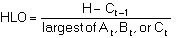
Where:
At = hight - closet-1
Bt = high - low
Ct = closet-1 - low
|
Parameter |
Function | ||||||||||||||
|
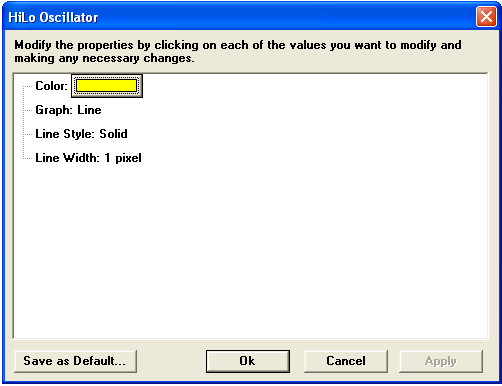
Color |
Default color is yellow. To change the color, click on the color button:
Then choose the color you want from the Color Menu.
| ||||||||||||||
|
Graph |
Sets the drawing method for the study.
| ||||||||||||||
|
Line Style |
Sets the rendering technique of the graph parameter (if it is set to Line).
| ||||||||||||||
|
Line Width |
Sets the tickness of the study line.
|
see, Kaufman, P. J., The New Commodity Trading Systems and Methods, New York: John Wiley & Sons, 1987.

