![]()
|
|
|
|
Historical Volatility is a measure of price fluctuation over time.
Historical volatility uses historical (daily, multi-day, weekly, monthly, quarterly, and yearly) price data to empirically measure the volatility of a market or instrument in the past. The value displayed by a historical volatility study is the standard deviation of bar-to-bar price differences.
On all historical charts, price differences are measured on a settlement-price to settlement-price basis. To calculate the historical volatility study, you must first identify the mean and then calculate the standard deviation.
Formula:
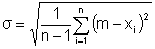
Where:
s = standard deviation, or historical volatility
n = number of occurrences (bars)
m =mean
xi = price changes
And:
Mean:

Where:
m = mean
n = number of occurrences
xi = price changes
And:
xi can equal percent of price change:

Or:
xi can equal natural logarithmic price change:

|
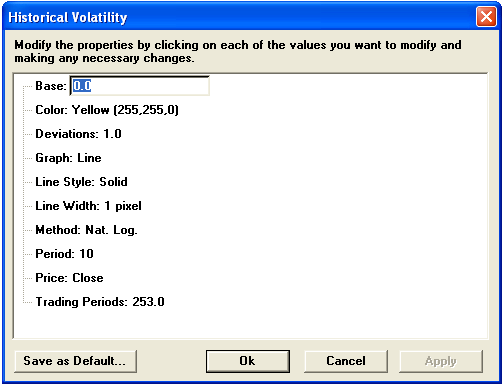
Parameter |
Function | ||||||||||||||||||
|
Base |
Default is 0.
| ||||||||||||||||||
|
Color |
Default color is yellow. To change the color, click on the color button:
Then choose the color you want from the Color Menu.
| ||||||||||||||||||
|
Deviations |
Default is 1.0
| ||||||||||||||||||
|
Graph |
Sets the drawing method for the study.
| ||||||||||||||||||
|
Line Style |
Sets the rendering technique of the graph parameter (if it is set to Line).
| ||||||||||||||||||
|
Line Width |
Sets the tickness of the study line.
| ||||||||||||||||||
|
Method |
Nat. Log (Default) Percent Change
| ||||||||||||||||||
|
Period |
Default is 10
| ||||||||||||||||||
|
Price |
The price on which the study is calculated:
| ||||||||||||||||||
|
Trading Periods |
Default is 253.0 |
©2008 Aspen Research Group, Ltd. All rights reserved. Terms of Use.

