|
|
The Implied Volatility study uses the value of options on an underlying instrument to estimate the underlying instrument's volatility. To calculate the Implied volatility you need to know the following information:
The price of the underlying instrument
The market price of an option
The strike price of an option
The expiration date of an option
The interest rate, if applicable
Yield/Foreign interest rate, if applicable
Given this information, Aspen Graphics enables you to solve for a volatility that leads to an option's market price. The resulting volatility is implied because it is based on the notion that the market takes the option's price to be correct. In other words, the implied volatility is the market's opinion of what the underlying instrumentís volatility should be.
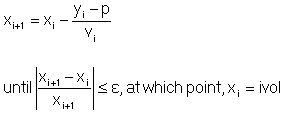
Formula
Implied volatility is a calculation that uses an optionís Vega (its sensitivity to change in volatility) to derive an estimate of volatility.

Where:
p = option price
xi = volatility
yi = optionís theoretical value at volatility xi
vi = optionís Vega at theoretical value yi
e = degree of accuracy
Parameters
The implied volatility study enables you to create four implied volatility study lines.
The Implied Volatility study is unique in that it is the only Aspen Graphics study with multiple parameters. The parameters you can change depend on the instrument you display in the active chart window. When you use the Implied Volatility study, Aspen generates applicable parameters based on the type of instrument you are analyzing. There are two sets of Implied Volatility parameters, one for options, and another for underlying instruments.
The Implied Volatility parameters menu for options contains four fields, one field for each study line. The fields are labeled Ivol 1, Ivol 2, Ivol 3 and Ivol 4:
For each field, or study line, you can the following parameters:
|
Parameter |
Function |
|
Underlying |
The underling instrument used to evaluate the Implied Volatility study.
|
|
Strike Price |
The strike, or exercise price, used to evaluate the Implied Volatility study.
|
|
Expiration |
The expiration date of the option.
|
|
Accuracy (%) |
Accuracy of Implied Volatility calculation. The default is 0.1%. This field controls whether a study line is drawn (if you enter zero, no study line is rendered), and the degree of accuracy to which the implied volatility value is calculated. Implied Volatility is an iterative calculation; the smaller the degree of accuracy, the more intensive the calculation.
|
|
Offset |
Optional adjustment to the underlying instrumentís price. The value in this field is added to the price of the underlying instrument to price an option against a different underlying instrument. Offsetting the underlying price is also used for pricing futures options against futures options on a different future month.
|
|
Base |
Base for certain interest rate futures, where the quoted futures price is derived by subtracting the discount yield from a base. (Short term interest rate futures (Eurodollars, Treasury Bills) have a base of 100.00. All other contracts and their options do not have a base. The value used in implied volatility calculations is the quoted price subtracted from the base.) This field is not applicable unless youíre evaluating an interest rate future.
|
|
Interest Rate |
Interest rate adjustment.
|
|
Yield/Frate |
Foreign interest rate if instrument is a foreign currency; dividend yield if the instrument is a stock or stock index. The Yield/Frate record is not displayed if the instrument in the active chart window is a future.
|
|
Year |
Type Specifies the type of year used in the calculation. The choices are:
Changing the year type changes the number of days per year, as shown in the Days per Year field.
|
|
Days per Year |
Specifies the number of days per year.
|
|
Price |
Specifies the price used in the calculation. Selecting this field displays the Price menu.
|
|
Color |
Specifies the color of the line rendered in the implied volatility study. Selecting this field displays the Color menu.
|
|
Graph |
Specifies the rendering method for the line in the implied volatility study. Selecting this field displays the Graph menu. |
If the instrument in the active chart window is an underlying instrument, the Implied Volatility parameters menu changes.
First, since the underlying instrument is in the chart, the Underlying record disappears. In its place, the parameters menu creates an Ivol Type record and an Option Root record.
|
Record |
Function |
|
Ivol |
Type Specifies the type of Implied Volatility graph you want. Your choices are listed in the Ivol Type menu. In this menu, selections that are followed by a plus sign (+) indicate just above the money, and selections that are followed by a minus sign (-) indicate just below the money. |
|
Option Root |
The symbol root of the option against which the stockís implied volatility is evaluated. |