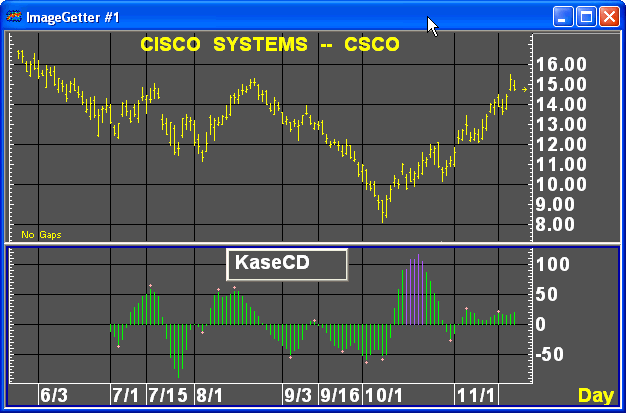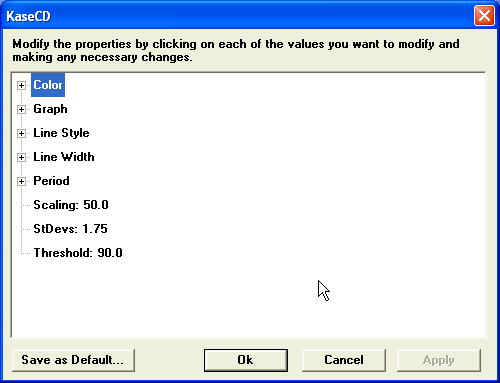
The KaseCD study for Aspen Graphics utilizes proprietary formulas to establish histogram-based market indicators. Four of the five study elements may be altered to produce a highly customized result.

Parameters

There are five study elements in the KaseCD study. Two elements are study variables:
Cycle Range Low
Cycle Range High
Three elements are rendered indicators:
KCD Line
KCD Peak
KCD PeakOut
|
Field |
Function |
|
Period |
Indicates the number of bars used to calculate the standard deviations for each variable used in the KaseCD indicator.
Defaults:
Cycle Range Low – 8 Cycle Range High – 65
|
|
Threshold |
Specifies the adjustment to the study calculation. The formula threshold compensates for significant price gaps using the specified percentage. Default is 90.
|
|
StDevs |
Indicates the multiplier of the Standard Deviation for each KaseCD indicator. Default is 1.75.
|
|
Scaling |
Indicates the price element (High, Low, Open, Close) used to calculate the Kase DevStop study. Defaults: KCD Line – 50.0
|
|
Color |
Indicates the color in which the respective study element is rendered. Defaults: KCD Line – Green KCD Peak – Pink KCD PeakOut – Purple
|
|
Graph |
Indicates the rendering method for the respective study element. Defaults: KCD Line – Histogram KCD Peak – Dots KCD PeakOut – Histogram
|
|
Line Style |
|
|
Line Width |
|