![]()
![]()
|
|
|

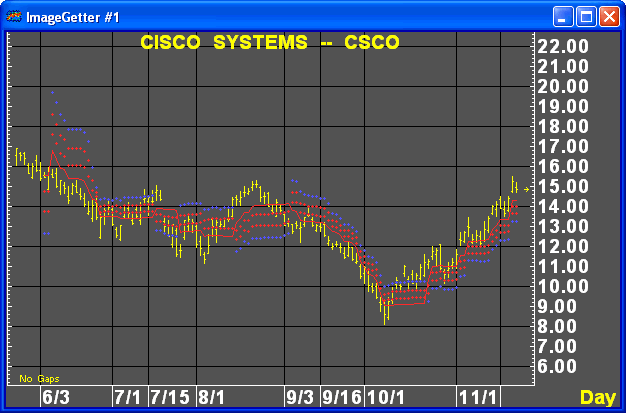
The Kase Dev Stops system finds the optimal statistical balance between letting profits run, while cutting losses. Kase DevStop seeks an ideal stop level by accounting for volatility (risk), the variance in volatility (the change in volatility from bar to bar), and volatility skew (the propensity for volatility to occasionally spike incorrectly).
Kase Dev Stops are set at points at which there is an increasing probability of reversal against the trend being statistically significant based on the log normal shape of the range curve. Setting stops will help you take as much risk as necessary to stay in a good position, but not more.
Variance
Simply, variance can be understood to be the degree to which individual observations vary from the average or mean observation.
Example: Imagine two different market conditions. In each condition, the average range of the market is $1 per day. However market 1 is highly varied with bars ranging from $0.20 to $5. Market 2 is regular, with bars ranging from $0.50 to $2.00. Thus, market 2 has less variance, and is less risky.
Application
The DevStop overlay is based on various numbers of standard deviations above the mean over a 2-bar reversal. Using standard deviations automatically accounts for variance and allows the user to quantify the odds of being stopped out based on a normal distribution.
DevStop uses standard deviations at three levels. The stops are shown as colored indicators at a defined distance from a red Mean Line.
The application of the three level stops are as follows:
Narrow stop: Red
dot closest to Mean Line. Use early in the trade (prior to break-even)
and late in the trade when indications are that a major reversal or end
of the trend is imminent.
Medium stop: Red
dot furthest from Mean Line. Use as an intermediate stop to lighten up
on trade-size during possible reversals.
Wide stop: Blue dot. Safest of the three. Use most of the time.
Interpretation
The DevStop indicator consists of four exit points, a Warning Line and Dev 1, 2, and 3. Two closes against the Warning count as Dev 1.

To speed up the crossover of the stop from long to short, simply change the moving averages to crossover more quickly, for example to 3 and 13. To decrease the amount of the stops, that is, to pull them in, reduce the standard deviation settings.
Parameters
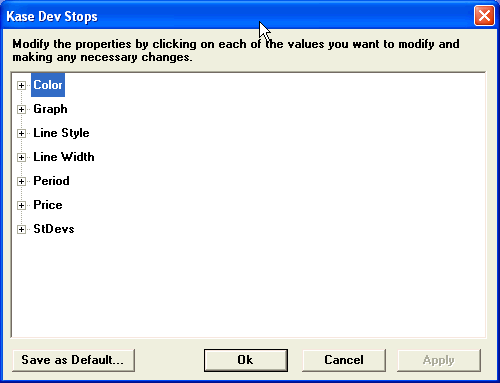
There are ten study elements in the Kase Dev Stop study.
Six elements are study variables:
Period
Slow Average
Fast Average
Price 1
Price 2
Price 3
Four elements are rendered indicators:
Warning
Dev 1
Dev 2
Dev 3
|
Field |
Function |
|
Period |
Indicates the number of bars used to calculate the standard deviations for each variable used in the DevStop indicator. Defaults: Period – 30 bars Slow Average – 21 bars Fast Average – 10
|
|
StDevs |
Indicates the multiplier of the Standard Deviation for each DevStop indicator. Defaults: Warning – 0.0 Dev 1 – 1.0 Dev 2 – 2.2 Dev 3 – 3.6
|
|
Price |
Indicates the price element (High, Low, Open, Close) used to calculate the Kase DevStop study. Defaults: Price 1 – Close Price 2 – High Price 3 – Low
|
|
Color |
Indicates the color in which the respective study element is rendered. Defaults: Warning – Red Dev 1 – Red Dev 2 – Red Dev 3 – Blue
|
|
Graph |
Indicates the rendering method for the respective study element. Defaults: Warning – Line Dev 1 – Dots Dev 2 – Dots Dev 3 – Dots |