![]()
![]()
|
|
|
|
The MACD is an oversold/overbought indicator that looks at the relationship between a long term and a short term moving average. The MACD line is the difference between the two moving averages. A second line, the signal line, is a short-term moving average of the MACD line. By default, the MACD employs a smoothing factor in an exponential moving average. However, these defaults can be changed by choosing different moving average calculations and/or different numbers of periods in the MACD parameters menu.
Formula:
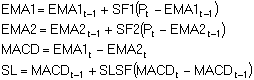
Where:
EMA1t = current value of 1st exponential moving average
EMA2t = current value of 2nd exponential moving average
EMA1t-1 = previous value of 1st exponential moving average
EMA2t-1 = previous value of 2nd exponential moving average
SF1 = smoothing factor for EMA1
SF2 = smoothing factor for EMA2
MACDt = current MACD value
MACDt-1 = previous MACD value
SLSF = signal line smoothing factor
When using the standard MACD, a buy signal is commonly interpreted when the MACD line is below the signal line and then crosses the signal line. The point at which the MACD crosses the signal line is the buy indicator. A sell signal is commonly interpreted when the MACD line crosses the signal line from above.
|
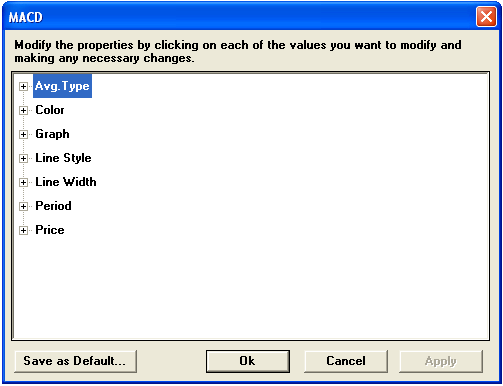
Parameter |
Function | ||||||||||||||||||
|
Avg. Type |
Sets the type of calculation for the for Average 1, Average 2 and the Signal Line:
| ||||||||||||||||||
|
Color |
Default color for the MACD Line is green. Default color for the Signal Line is yellow. To change the color, click on the color button:
Then choose the color you want from the Color Menu.
| ||||||||||||||||||
|
Graph |
Sets the drawing method for the study.
| ||||||||||||||||||
|
Line Style |
Sets the rendering technique of the graph parameter (if it is set to Line).
| ||||||||||||||||||
|
Line Width |
Sets the tickness of the study line.
| ||||||||||||||||||
|
Period |
Default for Average 1 is 0.1 Default for Average 2 is 0.2 Default for Signal Line is 0.3 | ||||||||||||||||||
|
Price |
The price on which the Average 1 and 2 are calculated:
|
Notes
MACD uses moving averages, which are lagging indicators, to create a leading indicator. The MACD consists of two lines, an MACD line and a Signal Line. The MACD line is the difference between two moving averages. The Signal Line is an exponential moving average of the MACD line. The resulting study is a pair of lines that oscillates above and below zero, with no upper or lower limit.
The common MACD is the difference between a 26-day and a 12-day exponential moving average. Gerald Appel and others have offered alternate moving average lengths that are specific to different instrument types. Use the parameters menu to adjust the lengths of the MACD moving averages.
MACD produces the following types of signals:
divergence
moving average crossover
centerline crossover
Positive divergence occurs when the MACD advances while the instrument is still in a downtrend. Negative divergence occurs when the MACD falls while the instrument is in an uptrend.
The Signal Line is adjustable, exponential moving average of the MACD. A bullish moving average crossover occurs when MACD moves above the Signal Line. A bearish moving average crossover occurs when MACD moves below the Signal Line.
A bullish centerline crossover occurs when the MACD moves above the zero line into positive territory. A bearish centerline crossover occurs when the MACD moves below the zero line into negative territory.
see, Appel, Gerald, The Moving Average Convergence-Divergence Trading Method, New York: Signalert Corporation.

