![]()
![]()
|
|
|
|
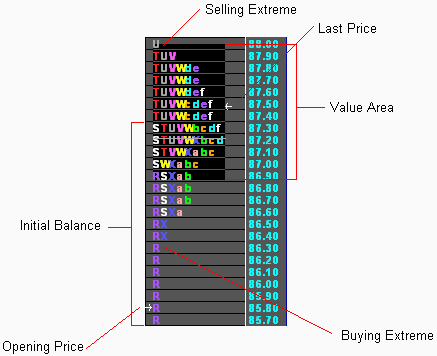
Figure 1: Market Profile elements.
Market Profile® is a market analysis technique that provides a daily perspective with an insight into intraday movement. It is an approach that places market activity under a microscope. Market Profile® organizes chaotic price movement and provides a real-time view of how buyers and sellers are interacting. Market Profile® is particularly adept at identifying price levels that are attractive to buyers and sellers.
The principles of Market Profile® apply to futures, stocks, options, cash, and spreads.
The function of the market is to facilitate trade. To accomplish this, the market probes high prices to attract sellers and low prices to attract buyers. The result of the rotation process is the discovery of prices that are acceptable to both the buyers and the sellers. An imbalance of buyers will drive prices higher until sellers are attracted to higher prices. The sellers enter the market, compete, and move prices lower. This imbalance of sellers drives prices lower until buyers are again attracted to lower prices. Buyers enter and compete, moving prices higher again. Market Profile® organizes this ebb and flow of buying and selling by price and time to create profiles of market activity. The typical bell curve profile is seen in Figure 1.
Each letter within the profile is referred to as a Time Price Opportunity, or TPO, and as the day progresses, the letters form a profile of the acceptance and rejection of prices by buyers and sellers. Price is tracked on the vertical axis and time on the horizontal axis, with a letter assigned to each half-hour period of trading. For example, in the CBOT TPO scheme, the capital letter A represents the half hour period beginning at 9:00 and ending at 09:30 Eastern. The capital letter B represents the half hour period beginning at 09:30 and ending at 10:00 Eastern, and so on. As the trading day progresses, a profile is created. When trading drives prices higher, you have an indication of the half hour period during which the buyers were active. Similarly, as buying subsides, letters begin to "pile up," giving you a valuable perspective on resistance levels. The converse is also true.
The prices at which the market spends the most time are considered fair value. For purposes of analysis, the value area represents the prices at which approximately seventy percent of the volume of the completed day's activity occurred. Therefore, price, time and volume are the key ingredients in the calculation of value. The value area provides a reference for support and resistance for the next trading session (see, Figure 1).
The first two half-hour periods, or first hour of trading, creates what is called the initial balance. In the 1980s, this range carried more significance than it does now, for it was regarded as reflection of how pit traders were positioning their inventories. The initial balance remains an important consideration, but pit activity is less a force than in the past, which lead to the advent of Market Profile+ (MP+). Use the initial balance as a benchmark for identifying range extensions, and as a criterion for determining the profile's day structure.
A range extension is any new high or low made after the initial balance is established. A range extension is significant in tracking buying and selling. A range extension that makes a new high above the initial balance is caused by an imbalance of buying pressure, and is clarified as a buying range extension. A range extension that makes a new low below the initial balance is caused by an imbalance of selling pressure and is clarified as a selling range extension.
The result of the market's constant probing of high and low prices can result in an extreme, which is defined as one or two TPOs (letters) at the top or bottom of the profile. Normally, a selling extreme occurs at the top of a profile and is the result of competition among sellers attracted to higher prices combined with a lack of buyers. Conversely, a buying extreme occurs at the bottom of the profile and is the result of competition among buyers attracted to lower prices combined with the absence of sellers. A low or high made during the last half hour period is not considered an "extreme" because it cannot be tested by subsequent trading activity.
Extremes and range extensions are used to categorize responsive and initiating behavior of market participants. This behavior is identified by determining where the current day's extremes and range extensions are occurring with respect to the prior day's value area. Buyers normally respond to prices below value; therefore, buying extremes and range extensions that occur below the prior day's value area represent responsive buying. Conversely, buying extremes and range extensions that occur above or within yesterday's value area represent initiating buying. Similarly, selling extremes and range extensions that occur above the prior day's value are represent responsive selling, as sellers normally respond to prices above value; and selling extremes and range extensions occurring below or within yesterday's value are represent initiating selling.
By identifying the position of buying and selling activity with respect to the established value are, it is possible to assess the strength of market conviction and, therefore, of market direction. Responsive activity is the normal response for buyers and sellers--buy low, sell high. Initiating activity is a stronger form of behavior, and one that shows greater conviction. When sellers are active below the previous day's value, as revealed by an initiating selling extreme and initiating selling range extension on increasing volume, there is a high probability that the market will continue lower due to an imbalance of strong selling activity.
A powerful aspect of the Market Profile® approach is that it provides a visual display of market activity. The characteristic bell curve shape evolves and varies according to the degree of market balance and imbalance between buyers and sellers. These varied shapes, or day structures are categorized as non-trend, normal, normal variation, trend, neutral, and running profile. The most important thing to keep in mind when reviewing the day structure is not the final shape, but how and when the profile is formed. This information provides insights into how the buyers and sellers are interacting.
©2008 Aspen Research Group, Ltd. All rights reserved. Terms of Use.