![]()
![]()
|
|
|
|
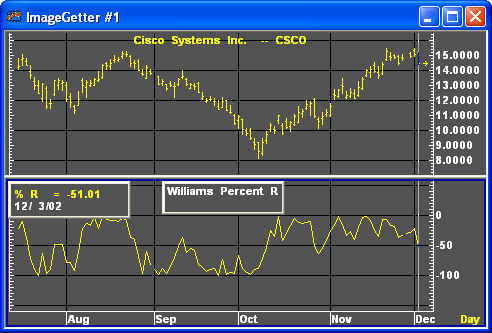
Technically a stochastic, Williams %R signals overbought and oversold conditions by calculating the relationship of the close to a range of prices. The scale in Williams %R is reversed, running from -100 to 0. When the %R line is above -20, overbought conditions exist; conversely, when the %R line is below -80, oversold conditions exist.
Formula:
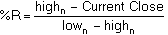
Where:
n = number of periods
highn = highest high in n periods
lown = lowest low in n periods
|
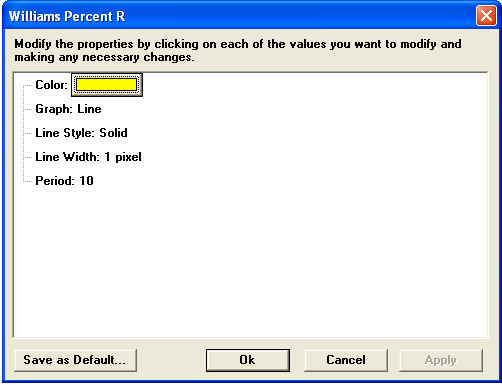
Parameter |
Function | ||||||||||||||
|
Color |
Default color is yellow. To change the color, click on the color button:
Then choose the color you want from the Color Menu.
| ||||||||||||||
|
Graph |
Sets the drawing method for the study.
| ||||||||||||||
|
Line Style |
Sets the rendering technique of the graph parameter (if it is set to Line).
| ||||||||||||||
|
Line Width |
Sets the tickness of the study line.
| ||||||||||||||
|
Period |
|
see, Larry R. Williams, How I Made $1,000,000 Trading Commodities Last Year, 3rd Ed., Monterey CA: Conceptual Management, 1979; see also, Murphy, John J., Technical Analysis of the Futures Markets, A Comprehensive Guide to Trading Methods and Applications, New York: New York Institute of Finance, A Prentice-Hall Company, 1986, pp. 309-310.

