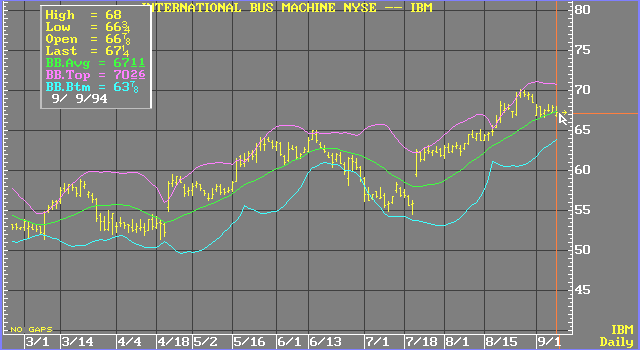
Bollinger Bands
Bollinger bands are lines drawn at a fixed interval around a moving average as a function of a market
’s volatility. The lines, or Bollinger Bands, are plotted above and below the chosen moving average at a distance equal to two times the root mean square of the deviations, or Standard Deviation, from the moving average. The length of the data used in the equations is equal to the length of the simple moving average employed.
Standard Deviation is a method of measuring the volatility or dispersion of a data series. To calculate Standard Deviation, you need a data series and a constant number of periods. First, you add the values of the data points in the data series. Then, proceed with the following steps:
1. Divide the sum by the number of data points, or Periods.
The quotient is the Arithmetic Mean.
2. Subtract the Arithmetic Mean from each data point.
The results are the Raw Deviations.
3. Square each Raw Deviation.
The products are the Squared Deviations. (Squared Deviations eliminate negative numbers.)
4. Add the Squared Deviations.
The sum is the Total Squared Deviation.
5. Divide the Total Squared Deviation by the number of data points, or Periods.
The quotient is the Mean Squared Deviation.
6. Calculate the square root of the Mean Squared Deviation.
The result is the Standard Deviation.
Formula:
1. ![]()
2. ![]()
3. ![]()
4. ![]()
5. ![]()
6. ![]()
Where:
SD = standard deviation
MSD = mean squared deviation
TSD = total squared deviation
D2 = squared deviation
D1 = raw deviation
AM = arithmetic mean
P = number of periods
DP = data point
see, Bollinger, John, Capital Growth Letter.
See also:Bollinger Bands Function