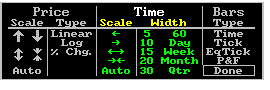
The Normally when a chart is drawn the right-most bar reflects the most current price. The program allows you to shift the time frame of charts in order to view older data or to place time periods that have not yet occurred within the window for the purpose of making projections. You can shift the time scale of a chart with the Changing the Time Scale