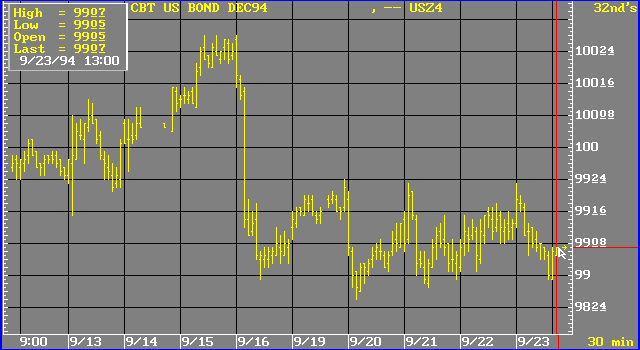
Chart Windows
The program provides flexibility in creating charts and combining charts with analyses. A comprehensive menu of traditional technical studies provides a foundation upon which to build the perspective your trading requires. Additionally, you can create and chart your own formulas. Unique charting features like transparent windows, logarithmic and percent change scaling, and the ability to plot several instruments in the same chart provide a vantage that fosters a real-time evaluation of today
’s worldwide marketplace.
Before beginning this module, you should be familiar with the basic techniques used to add, move, size, and select a window. If you are not familiar with these basics, please review the
Mouse Basics, Menu Basics, Window Basics, and Page Basics help topics.Topics: