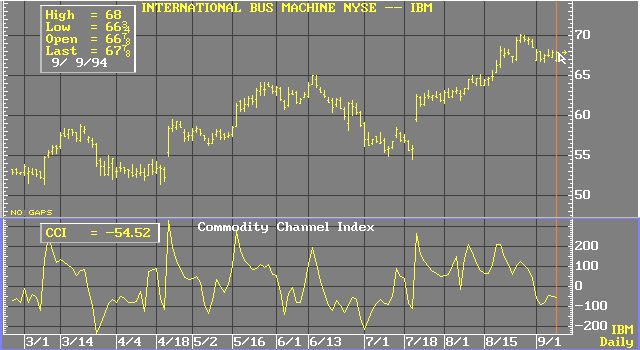
Commodity Channel Index (CCI)
The Commodity Channel Index is an indicator designed for use in markets that follow definite cyclical patterns. While the CCI does not determine cycle lengths, if you have an idea of cycle length, the CCI can be a valuable timing tool.
Formula:
![]()
![]()
Where:
n = number of periods
TPt = the current typical price:
![]()
MAt = current simple moving average
MD = mean deviation
Pn = price
Donald R. Lambert, who originated the CCI, suggests using a number of periods less than one-third of the cycle length. Using this calculation, seventy to eighty percent of random price fluctuations should fall within the +100% to -100% range. If the CCI yields a value above +100%, a long position may be indicated. When the CCI value falls below +100%, closing a long position should be considered.

Short positions may be interpreted using the converse of this technique at the -100% level.
see, D. R. Lambert,
“Commodity Channel Index: Tool for Trading Cyclic Trends,” Commodities [now Futures] Magazine, October, 1980, pp. 40-41.See also:Commodity Channel Index Function