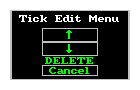
To delete a bad tick in a Time & Sales window, follow these steps: 1. Find the bad tick on a bar chart using the bar chart cursor. 2. Display a Time & Sales window. 3. Use the 4. Highlight the line containing the incorrect price. 5. Select the line containing the incorrect price. The tick correction window is displayed. 6. In the tick correction window, highlight the incorrect price. 7. Press A line is drawn through the incorrect price in the tick correction window and in the Time & Sales list. The tick is deleted from all charts built from tick data. 8. Exit the Tick Correction window. The Tick Edit Menu is displayed. 9. Select DELETE.Deleting Bad Ticks
Note the date and time in the cursor display window so you can quickly locate the incorrect price in a Time & Sales window. The smaller the time base on the chart, the easier it is to locate the time and date of the incorrect price.![]() Press
Press ![]() Move the mouse pointer over the incorrect price.
Move the mouse pointer over the incorrect price.![]() Press
Press ![]() Click the left mouse key.
Click the left mouse key.![]()
![]() Press
Press ![]() Move the mouse pointer over the incorrect price.
Move the mouse pointer over the incorrect price.![]()
![]() Press
Press ![]() While the pointer is in the tick correction window, hold the right mouse key down and click the left mouse key.
While the pointer is in the tick correction window, hold the right mouse key down and click the left mouse key.