Drawing Speedlines
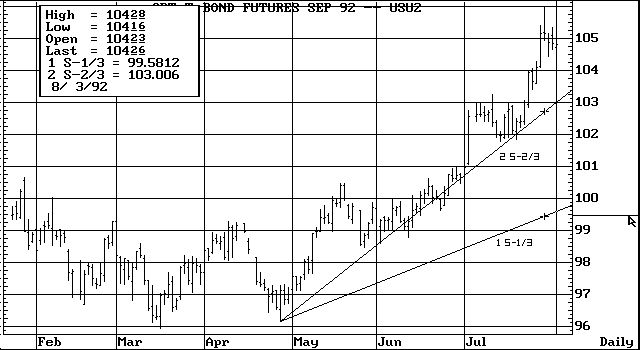
Speedlines are a method of trend identification that utilizes the idea of dividing a trend into thirds. Speedlines help identify the rate of ascent or descent of a trend (e.g., its speed).

To construct a bullish speedline, you need to identify the origin price of the up trend and the highest price of the up trend. The speedline function connects these two points with a vertical line and divides the resulting vertical line into thirds, rendering trend lines from the origin point through the resulting thirds.
The converse of this process renders a bearish speedline.
Each time a new high is set in an up trend or a new low is set in a downtrend, you need to adjust your speedlines.
Theoretically, if a trend is correcting itself, it will usually stop at the 2/3 speedline. If not, prices will seek out the 1/3 speedline. If the 1/3 line is also broken, prices may continue to seek the origin level of the trend. Trends reverse if the origin level is broken.
To draw speedlines, follow these steps:
1. Identify the origin of a trend and the highest or lowest point of the trend.
2. Display the Trend Line Functions menu.
3. Select Speedlines.
The trend line cursor changes to a pencil.
4. Mark the origin point of the trend.
![]() Click the left mouse key.
Click the left mouse key.
![]() Press
Press
5. Move the pencil to the highest or lowest point in the trend.
![]() Press the arrow keys.
Press the arrow keys.
![]() Drag the pencil by moving the mouse.
Drag the pencil by moving the mouse.
A horizontal line appears as you move the pencil.
6. Mark the high or low.
![]() Click the left mouse key.
Click the left mouse key.
![]() Press
Press
Speedlines are drawn.