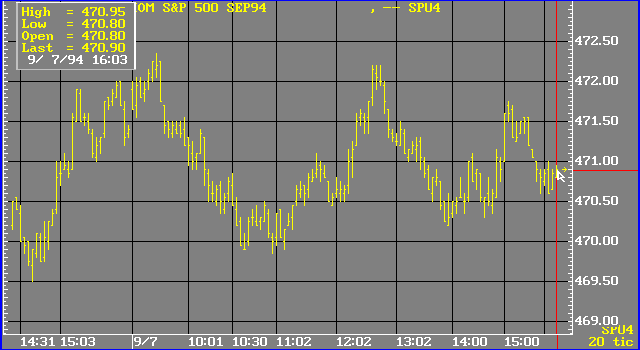
EquiTick Charts
Traditionally, bars consist of trades during a given time period during the trading day. The program enables you to display bars that consist of a fixed number of trades. Charts of this type are called Equi-Tick, or bar-by-tick, charts.
To display an Equi-Tick chart, follow these steps:
1. Display a chart.
2. Enter an instrument symbol.
3. Enter the EQTICK command, a space, and a positive integer, i.e.,
EQTICK 20
An Equi-Tick chart is displayed. If you enter the command above, all bars will contain twenty trades.
You can create Equi-Tick charts consisting of any number of trades. The positive integer following the .EQTICK <n> command governs the number of trades in each bar. Once you use the .EQTICK command, the chart is in EquiTick mode. Typing a number changes the number of ticks per bar. To change the chart to conventional bars, display the Rescale menu and, under the Bars Type heading, select Time.
The number of bars you can see on a Equi-Tick chart depends on the size of your TICS.DAT datafile. All bar-by-tick charts utilize tick data.
