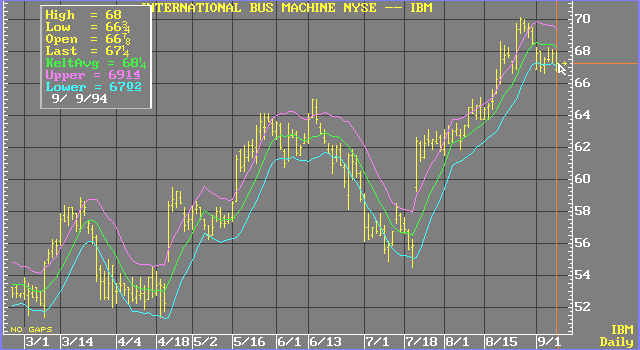
Keltner Channel
Keltner channels help you identify market trends. Keltner channels compare today
’s prices with yesterday’s prices. An absence of new highs indicates a down trend. An absence of new lows indicates an up trend. In conjunction with this method of trend identification, the Minor-Trend Rule is used. The Minor Trend Rule states that the minor trend is bullish if the daily trend sells above its most recent high: conversely, the minor trend is bearish if the daily trend sells below its most recent low.
A Keltner channel study consists of a moving average and two channel lines. The channel lines are drawn by adding to and subtracting from the current moving average value the product of a constant multiplied by the average true range of each bar.
Formula:
Center Line:
![]()
Where:
CL = center line
EAVG = exponential moving average
n = number of bars
P = price
And:
Average True Range:
![]()
Where:
ATR = average true range
R = range
n = number of bars
H = high
L = low
And:
Upper Channel Line:
![]()
Where:
UP = upper channel value
CL = center line
ATR = average true range
C = constant
And:
Lower Channel Line:
![]()
Where:
DN = lower channel value
CL = center line
ATR = average true range
C = constant
see, Chester W. Keltner, How to Make Money in Commodities, Kansas City, MO: The Keltner Statistical Service, 1960; see also, Perry J. Kaufman, The New Commodity Trading Systems and Methods, New York: John Wiley & Sons, 1987.