Moving Average Convergence Divergence
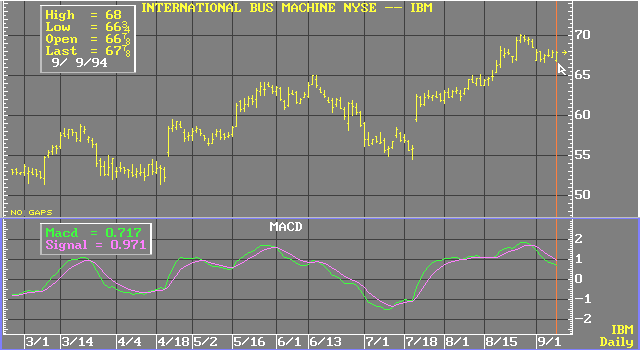
The MACD is an oversold/overbought indicator that looks at the relationship between a long term and a short term moving average. The MACD line is the difference between the two moving averages. A second line, the signal line, is a short-term moving average of the MACD line. By default, the MACD employs a smoothing factor in an exponential moving average. However, these defaults can be changed by choosing different moving average calculations and/or different numbers of periods in the MACD parameters menu.
Formula:
![]()
![]()
![]()
![]()
Where:
EMA1t = current value of 1st exponential moving average
EMA2t = current value of 2nd exponential moving average
EMA1t-1 = previous value of 1st exponential moving average
EMA2t-1 = previous value of 2nd exponential moving average
SF1 = smoothing factor for EMA1
SF2 = smoothing factor for EMA2
MACDt = current MACD value
MACDt-1 = previous MACD value
SLSF = signal line smoothing factor

When using the standard MACD, a buy signal is commonly interpreted when the MACD line is below the signal line and then crosses the signal line. The point at which the MACD crosses the signal line is the buy indicator. A sell signal is commonly interpreted when the MACD line crosses the signal line from above.
see, Appel, Gerald, The Moving Average Convergence-Divergence Trading Method, New York: Signalert Corporation.