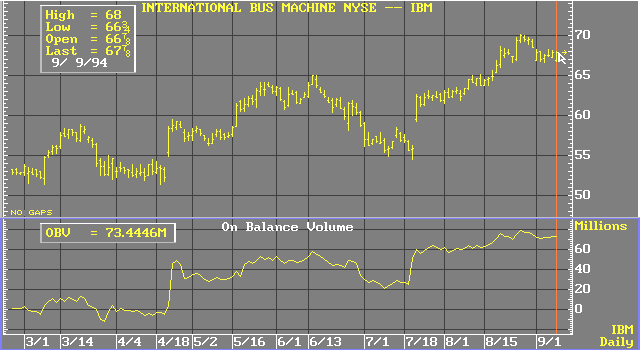
On Balance Volume (OBV)
On balance volume is an indicator that attributes volume (or tick volume on intraday charts) in an up period (i.e., where the close is greater than the previous close) represents buying and volume in a down period represents selling. The calculation is a simple accumulation process. If a period closes up, its volume is added to the total. If a period closes down, its volume is subtracted from the total.
Formula:
![]()
If x is positive, add x to the close.
If x is negative, subtract x from the close.
Where:Ct-1 = previous close
C = current close
x = volume
The direction of the OBV line is more important than the volume level at any particular point. The OBV line assumes an arbitrary positive integer as a starting point; this ensures a positive OBV value. The OBV follows any market trend, except when a reversal occurs. A divergence is often interpreted as a signal of a trend reversal.

see, John J. Murphy, Technical Analysis of the Futures Markets, A Comprehensive Guide to Trading Methods and Applications, New York: New York Institute of Finance, A Prentice-Hall Company, 1986, pp. 185-189; see also, Joseph Granville, Granville
’s New Key to Stock Market Profits, Englewood Cliffs, NJ: Prentice Hall, 1963.