Parabolic
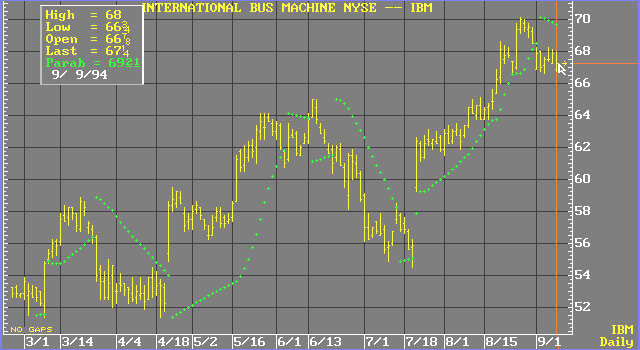
The parabolic study is a
“true reversal” indicator in that it is always in the market. Whenever a position is closed-out, it is also reversed. The point at which a position is reversed is called a Stop and Reverse (SAR). Although “stops” are plotted for each bar, a trade is reversed only when the SAR is penetrated by a price.Formula:
![]()
Where:
SARt+1 = next period
’s SARSARt = current SAR
AF = begins at .02 and increases by .02 to a maximum of .20
EP = extreme price (high if long; low if short)

The initial SAR or SIP (SAR Initial Point) of a long move is found by looking for the first bar with a higher high and a higher low than the previous bar. The converse of this is used to find the SIP for a short move. The acceleration factor changes as the trade progresses, starting at .02 and increasing in increments of .02 for each bar in which a new extreme occurs.
see, J. Welles Wilder, Jr., New Concepts in Technical Trading Systems, McLeansville, NC: Trend Research, 1978, pp. 9-22.