Point & Figure Charts
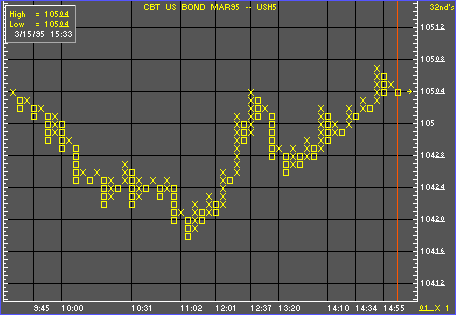
Like a bar chart, a point & figure chart plots price on a vertical scale; however, while a bar chart plots prices in a time continuum, point & figure charts plot price only. The
“X” symbol is used to record rallies and the “O” to record declines. Each time a trend reverses, a new column is started. The user has control over sensitivity to trend reversal through choice of “box size” and “reversal” amount.