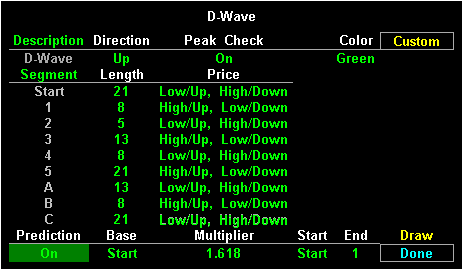
This study identifies D-Wave. The wave counts drawn above or below the high or low of each key bar of the pattern. (D-Wave values do not appear in the cursor window.) Each wave is defined by relationships between highs and lows.
If an up-wave search is requested, the start section is required to end on a price less than the preceding prices; then the next section ends on a price greater than preceding prices; and subsequent sections alternate less than and greater than conditions. A down-wave ends on a greater-than condition, and subsequent sections alternate less-than and greater-than conditions.
The first, or
“start” section is labeled with an “S”; the remaining sections are labeled with “1”, “2”, “3”, “4”, “5”, “A”, “B”, and “C”. Each label is drawn above its bar when the price condition is greater-than, below its bar when the price condition is less-than.
When the
“peak check” option is selected, section endpoints are required to have prices above or below prior prices as follows. (None of the tests defined in the next two paragraphs are applied if “peak check” is off.)
For an
“up” wave, point 3 must have a price greater than the highest high between points 1 and 2 inclusive, and point 5 a price greater than the highest high between points 3 and 4 inclusive. An L-bar high that is not higher than the preceding high price is ignored, and the section continues. Furthermore, the lowest low price between points 2 and 3 inclusive must be greater than the lowest low between points S and 1 inclusive, and the lowest low between points 4 and 5 must be greater than the lowest low between points 2 and 3. If either of these latter two conditions are violated, the up-wave formation is aborted, and a search for a new S point begins following point 2 or 4 respectively. Finally, point C is not recognized until it has a price less than the lowest low between points A and B inclusive.
For a
“down” wave, the tests are reversed. Point 3 must have a price less than the lowest low between points 1 and 2 inclusive, and point 5 a price less than the lowest low between points 3 and 4 inclusive. Furthermore, the highest high between points 2 and 3 inclusive must be less than the highest high between points S and 1 inclusive, and the highest high between points 4 and 5 must be less than the highest high between points 2 and 3. If either of these latter two conditions are false, the down-wave formation is aborted, and a search for a new S point begins following point 2 or 4 respectively. Finally, point C is not recognized until it has a price greater than the highest high between points A and B inclusive.
The user can select the length and highest high/lowest low price for each section of the wave. In addition to the usual High, Low, Close price options, select a
“High if Up wave, Low if Down wave” and “Low if Up wave, High if Down wave” choices; these will allow building symmetrical wave definitions.
You need to select the period to display the D-Wave. Please note that the wave only considers bars displayed in the chart.
Once the wave counts are defined, the user is able to make price projections using a multiplier, which is accessible in
the multiplier field.
The study command for TD Wave is .TDWAVE.