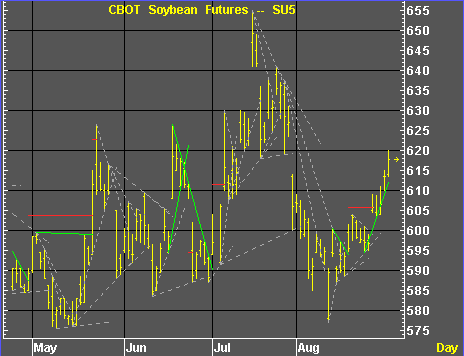
TD Lines are mechanically and objectively constructed. The trendlines drawn are TD Supply Lines and TD Demand Lines. Once the TD Lines are broken and qualified, the study automatically calculates a price projection. A qualified breakout appears as a solid line; whereas, a disqualified breakout is a dashed line.

TD Lines are drawn by connecting TD Points. A level one TD Point high is formed once a high is immediately preceded and succeeded by bars with lower highs. Thus, a level one high requires only three bars to make this determination. TD Point highs vary in
“magnitude” based on the number of immediately preceding and succeeding bars that have lower highs. For example, level two has two bars preceding, two bars succeeding, and so on through level nine.
The converse of these principles governs TD Point lows.
For further information on TD Lines, please refer to Thomas R. DeMark, The New Science of Technical Analysis, New York: John Wiley & Sons, 1994, Chapter 1.
Topics:
Qualifying TD Lines
Parameters