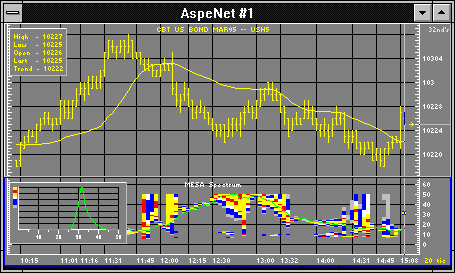
The MESA Spectrum study renders the frequency of data in a cycle. The Spectrum study consists of two graphs, a spectrum for showing amplitude, and a line graph showing cycle length at the position of the chart cursor.

The MESA Spectrum study has six adjustable parameters:

Although these parameters are adjustable, John Ehlers recommends that you do not change them.

MESA Spectrum