8 FORMULAS, COLOR RULES & ALARMS
Main Table of ContentsThe Aspen Graphics program includes a large number of studies, formulas, functions and color rules. Aspen Graphics also includes the ability for you to create your own studies, formulas, functions and color rules when those supplied with the program do not meet your needs. It is this ability to create and customize that we will focus on in this section.
The Parts of a Formula Top of Page
Formulas have three parts: a name, an equal sign and an expression.
Example: 21DayHigh = rmax($1.high,21)
Formula Name Equal Sign Expression
Formula Names
can be as descriptive as you like. You can use up to 19 characters, and an underscore ("_") can be used to add a space to your formula name, as in 3month_strip.| Aspen Graphics is not case sensitive. |
| DO NOT name your formula any of the following: 1. A symbol name 2. A number, such as 15 3. A command, such as .bye |
Expressions are where the calculations take place. They can contain:
constants (CLZ8, ibm, 42,etc.)
operators (+,-,*,/,>=,= = etc.)
variables ($1, $1.low, cl#, etc.)
functions (rmax( ), dev( ), if( ), etc.)
Constants
Constants can be any number or symbol sent by your datafeed.
Operators
Top of PageMath operators used in Aspen Graphics are shown in Table 1.
Operator |
What it Does |
Order of Evaluation (Operator in the formula that will be calculated first) |
^ |
Exponentiation | 1 |
- |
Negative | 2 |
+ |
Positive | 2 |
* |
Multiplication | 3 |
/ |
Division | 3 |
+ |
Addition | 4 |
- |
Subtraction | 4 |
= = |
Equals | 5 |
!= |
Does Not Equal | 5 |
> |
Greater Than | 5 |
< |
Less Than | 5 |
>= |
Greater Than or Equal To | 5 |
<= |
Less Than or Equal To | 5 |
Table 1
Top of PageParenthesis can be used to specify that a particular operation should be performed before other operations in the formula. For example:
(ng#+ng#1+ng#2)/3
First, add the three front months of Natural Gas, and then divide the sum by three.
Variables
Variables are placeholders. They stand for a quantity or an instrument that will be specified later when the formula is implemented. Types of variables include:
Instrument Variables
Top of PageThe advantage of using instrument variables ($1, $2, $3, etc) in a formula instead of a specific symbol (such as OEX, MSFT or CLZ8) is that it allows you to use the formula with any symbol you like. In other words, it makes the formula generic. The $1 saves a place for a symbol that will later be supplied.
Example: A spread formula written as:
Spread=cn8-ck8
This formula will be useful only as long as cn8 and ck8 are both trading; it will be useless after one of the contracts expires. A generic formula which could be used for any two instruments would be:
Spread=$1-$2
To chart this formula or to display this formula in a quote page, you would enter:
Spread(cn8,ck8)
The # macro is another type of variable for instruments, like futures, which expire. It is used in place of a symbol’s month and year codes to specify which of the currently trading contracts you want to evaluate. After the symbol root (sp for the S&P 500, cl for crude light, etc.), a # specifies the front month, #1 specifies the first month out, etc.
The # macro allows you to write a formula for futures which doesn’t have to be edited when one of the contracts expires.
Example: In October of 1998, a strip formula for the first three months of natural gas could be written:
NatGasStrip=(ngv8+ngx8+ngz8)/3
This would work, however, only as long as all three contracts were trading. After that, the formula would need to be changed to reflect the current three front months. For example:
NatGasStrip=(ngx8+ngz8+ngf9)/3
A more useful formula could be written:
NatGasStrip=(ng#+ng#1+ng#2)/3
This formula could be used anytime, and the first three months of natural gas, whatever they happened to be at the time, would be averaged.
Price Variables
Top of PagePrice Variables such as spz7.high and $1.avg, are used to designate which of the many possible prices and values associated with an instrument are to be used in the formula. These variables, or quote codes, are placed after the symbol and separated from it by a period, as shown in the previous examples. Table 2 is a list of quote codes to be used.
| Quote code |
Description |
| .avg | Average of the high, low and close prices for a bar |
| .avgtick | Average of the ticks on an EqTick bar |
| .close | Closing price for the period |
| .high | Highest price hit during the period |
| .last | Last price reported (includes bids, asks, trades and settles) |
| .low | Lowest price hit during the period |
| .midpt | Midpoint of the high and low prices for the period |
| .open | Opening price for the period |
| .prev | Closing price for the previous period |
| .thigh | "True High;" the higher of the current period high or the previous close |
| .tlow | "True Low;" the lower of the current period low or the previous close |
Table 2
In addition to the quote codes previously listed, any of the quote codes listed in Appendix B of this manual can be used in formulas. Be aware that not all of the quote codes are chartable. Check Appendix B before using a quote code in a formula that you intend to chart to verify that it is chartable.
Functions
Top of PageFunctions perform different types of calculations on the data. Aspen Graphics includes a variety of pre-programmed functions and gives you the ability to write your own functions as necessary.
Each function needs to be told what data to examine: a specific instrument, a variable like $1, a formula, number or some other series of data. In addition, there may be other parameters you need to specify as well depending on the type of function.
Tables 3, 4, and 5 list the functions that are programmed in Aspen Graphics, along with their required and optional parameters.
| Function | What It Calculates | Syntax Example | Required Parameters (Optional Parameters) | |
| Abs( ) | Absolute Value | abs($1.qty) | Instrument | |
| Dev( ) | Standard Deviation | dev(spm8,10) | Instrument, periods (shift) | |
| Disttomax( ) | Distance (in bars) to the highest value in a range | disttomax(ibm.high,1,9) | Instrument, starting bar of range, ending bar | |
| Disttomin( ) | Distance (in bars) to the lowest value in a range | disttomin(ibm.low,1,9) | Instrument, starting bar of range, ending bar | |
| Exp( ) | Exponentiation | exp($1.rate) | Instrument | |
| Log( ) | Natural Logarithm | log($1/($1.c.last)) | Instrument | |
| Log10( ) | Base 10 Logarithm | log10($1.xtime) | Instrument | |
| Max() | Highest value in group | max(us#,us#1,us#2) | All instruments to be evaluated | |
| Min( ) | Lowest value in group | min(us#,us#1,us#2) | All instruments to be evaluated | |
| Rangemax( ) | Highest value in a defined range | Rangemax(ch8,2,14) | Instrument, starting bar of range, ending bar | |
| Rangemin() | Lowest value in a defined range | rangemin(ch8,2,14) | Instrument, starting bar of range, ending bar | |
| Rmax() | Highest value over the last (number) periods | rmax(spm8.high,50) | Instrument, periods (shift) | |
| Rmin( ) | Lowest value over the last (number) periods | rmin(spm8.low,50) | Instrument, periods, (shift) | |
| Rsum( ) | Sum of the values over the last (number) periods | rsum(spm8,50) | Instrument, periods, (shift) | |
| Scale( ) | Units/number of decimal places in which a quote is displayed | scale(jy#,100) | Instrument, units or other instrument with the same units you want to use | |
| The Scale ( ) function is used in quote windows or pages, but not charts | ||||
| SQRT( ) | Square Root | sqrt($1.xdays) | Instrument | |
| SUM( ) | Sums all values listed | sum(ibm,msft,mu)/3 | All Instruments | |
| IF( ) | Conditional Statement (If, then, else) | if($1.prev<$1.low, $1.tlow,$1.low) | Desired criteria, value if TRUE, value if FALSE (Boolean operators AND and OR) | |
Table 3
Study Functions
Top of PageFunction |
What It Calculates | Syntax Example |
Required Parameters (Optional Parameters) |
| ADX( ) | Average Directional Index | adx(ch8,20) | Instrument, periods |
| BB( ) | Bollinger Bands | bb($1,20,2,1) (top) bb($1,20,-2,1) (btm) |
Instrument, Moving avg. length, Std. Devs, Envelope length (Shift) |
| Cci( ) | Commodity Channel Index | cci(sk8,10) | Instrument, periods |
| Dio( ) | Directional Indicator | dio($1,14) | Instrument, periods |
| Dmineg( ) | DI- line of the Directional Indicator | dmineg(smk8,14) | Instrument, periods |
| Dmipos( ) | DI+ line of the Directional Indicator | dmipos(smk8,14) | Instrument, periods |
| Eavg( ) | Exponential Moving Average | eavg($1,30) | Instrument, periods, (shift) |
| Fstoch( ) | Fast Stochastic (Fast K line) | fstoch($1,9) | Instrument, periods |
| Havg( ) | Hamming Moving Average | havg($1,30) | Instrument, periods, (shift) |
| Hvol( ) | Historical Volatility | hvol(gm,10) (default parameters: 10 periods, 1 Std. dev) |
Instrument, (Periods, Std. devs., Trading Periods/Year, Base 100) |
| Keltner( ) | Keltner Channel | keltner($1,20,1) (top) keltner($1,20,-1) (bottom) | Instrument, periods, multiplier (shift) |
| Mavg( ) | Modified Moving Avg. | mavg($1,30) | Instrument, periods (shift) |
| Mbestcycle( ) | MESA Best Fit | mbestcycle(cl#,6) | Instrument, periods |
| Mdomcycle( ) | MESA Standard Prediction | mdomcycle(cl#) | Instrument |
| Mom( ) | Momentum | mom(gcz8,10) | Instrument, periods |
| Mphase( ) | MESA Phase | mphase(ngz7) | Instrument |
| Mtrend( ) | MESA Trend | mtrend(ngz7,1) | Instrument, cycle factor |
| Rsi( ) | Relative Strength Index | rsi($1,14) | Instrument, periods |
| Savg( ) | Simple Moving Average | savg($1,30) | Instrument, periods (shift) |
| Sstoch( ) | FastD/ SlowK Stochastic Line |
sstoch(us#,9,3) | Instrument, periods for the FastK, periods for the moving avg. of the FastK |
| Ssstoch( ) | Slow Stochastic (Slow D Line) | ssstoch(us#,9,3,3) | Instrument, periods for the FastK, periods for the moving avg of FastK, periods for the SlowD |
| Wavg( ) | Weighted Moving Average | wavg($1,30) | Instrument, periods, (shift) |
Table 4
Chart Functions
Top of PageFunction |
What it Calculates |
Syntax Example |
Required Parameters (Optional Parameters) |
| Chart( ) | Provides a formula with a frame-of-reference similar to that of a chart | chart(rsi(ip,14)[-1],15, 1,100,1,3) | Formula or function, bar-width, bartype, numbars, nogaps, night session (Calc On/Off[-1]) |
| Gapfill( ) | Value with which to fill gaps on a chart | gapfill(cl#,cl#.thigh) | Instrument, formula, function or value to fill gap |
| Quote( ) | Quote displayed as a horizontal line in a chart | quote(csco.last) | Instrument Quote Code |
Table 5
Special Functions When is the Chart Function Used? Top of PageThere are three instances when you will need to use the Chart( ) function:
| When you display a study in a chart, some parameters for the study are implied in the chart: |

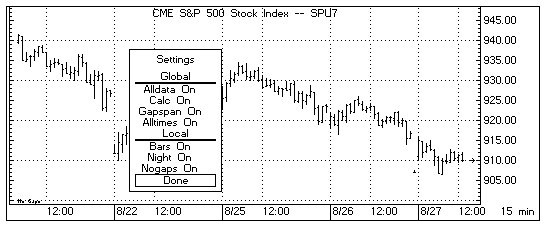
Figure 1
| A quote page or an alarm has no way knowing these things unless you use the Chart function to define these parameters! |
How is the Chart Function used? Top of Page
The Chart function is a shell which surrounds a function or formula giving it the same frame of reference provided in a chart.
| Write your function or formula, inc. all parameters. | Calc On If you don’t want the chart to recalculate after each trade omit this, and the chart function will recalculate when the bar is completed. |
How many
ticks, bars or days you want in each bar Ticks=1- 1000 Min=1-1439 Day=1-7, 30,90,365 |
Type of Bar: Ticks=0 Mins.=1 Days=2 |
How Many Bars
in the chart; 100 is optimal |
No-gaps 0=off 1=on |
Which Session? 1=All 2=Night Only 3=Days Only 0=Use setting from Setup.txt file |
How is a study value displayed on a quote page?
Top of PageLet’s use a 14-period RSI value as an example. If you were working on a chart, you’d want to specify the following parameters:
* You want 14 periods in the RSI study
* You want Calc On
* You want to calculate on the closing price of a daily bar
* You want Nogaps On
* You want to look at the Day session only
In the Formula Evaluator, enter the following:
Day_RSI=chart(rsi($1.close,14)[-1],1,2,100,1,3)
Now, go to your quote page or window, and format the cell like this:
Day_RSI($1)
When you enter a symbol in the quote window, you will see the daily RSI value for that symbol.
| For more information on formatting a quote page or window, refer to the Quotes chapter of this manual. |
Suppose you want to set an alarm to alert you if the RSI value is above 70, including the following parameters:
* You want a 9-period RSI on the current S&P future
* You want Calc On
* You want to calculate on a 60-minute time frame
* You want NoGaps off
* You want to monitor all trading sessions
You would enter the following for the Trigger Condition of the alarm:
chart((rsi(sp#,9)>70)[-1],60,1,100,0,1)
How are studies displayed in two time frames?
Top of PageIf you want to chart a study in two different time frames (to "screen out" minor trend reversals), you can write a study using the chart( ) function, and overlay it on a study using another time frame.
For example, to view both an hourly and a daily RSI on an hourly chart:
Bring up an hourly bar chart; split the window, and put an RSI study in the lower
window.
Daily_RSI(series)=chart(rsi($1,14)[-1],1,2,100,1,1)
Sometimes it is useful to change the units in which an instrument is quoted. The Scale function allows users to control how a value is displayed in a quote window or quote page.
For example, a formula in Aspen will normally be displayed in decimals. If you use a formula to evaluate Bonds, which trade in 32nd’s, you may also want to use the Scale function to display the result of the formula in 32nd’s.
The Scale function has two parameters. The first parameter identifies what you want to modify; this can be a price, quote code, formula or variable. The second parameter tells the Scale function what the units should be modified to resemble; this can be a number, instrument or variable.
For example, both scale($1.high,us#) and scale($1.high,32) will display the high value of any instrument in 32nd’s.
The Scale function can be used to:
| Modify a Price … | Example | Syntax |
| Using a number | to display Bonds to three decimal places | scale(usz8,1000) |
| Using an instrument | to display 10-yr notes like 5-year notes | scale(ty#,fv#) |
| Using a variable | to display corn like another instrument | scale(cn8,$1) |
Table 6
| Modify a Quote Code | Example | Syntax |
| Using a number | to display a bid in 64th’s | scale($1.bid,64) |
| Using an instrument | to display the last price like a stock | scale($1.last,ibm) |
| Using a variable | to display the net like another instrument | scale(ibm.net,$2) |
Table 7
| Modify a Formula | Example | Syntax |
| Using a number | to display percent change in 32nd’s | scale(pchg($1),32) |
| Using an instrument | to display P&L in increments like the S&P’s | scale(PandL($1),sp#) |
| Using a variable | to display a spread in the first symbol’s units | scale(spread1($1,$2),$1) |
Table 8
| Modify a Variable | Example | Syntax |
| Using a number | to display an instrument in 8th’s | scale($1,8) |
| Using an instrument | to display an instrument like the S&P’s | scale($1,sp#) |
| Using a variable | to display an instrument in other units | scale($1,$2) |
Table 9
Rounding and The Scale Function Top of PageCell width is important when you use the SCALE() function to modify the number of decimal places of any value. If a cell’s width will not accommodate a decimal value rendered by the SCALE() function, you may not get the value you expect.
If you use the SCALE() function to display an instrument quote value in decimals, and its cell is too short to display all decimal places, Aspen Graphics drops off the decimal places it cannot display. The numbers are there, but the display width is too short, so the numbers aren’t visible on the page.
In formula quotes, the SCALE() function truncates values modified by numbers and rounds values modified by instruments and quote groups when the display width is too short.
To avoid problems caused by inadequate cell width, remember to give yourself extra space when you use the SCALE() function. You can always make the cell smaller, but it is often difficult to make more room in a quote window.
Writing a Formula Top of PageFormulas are written in the Formula Listing menu. Bring up the Formula Listing menu by typing .form and then pressing b or by selecting Formulas from the Main Menu. You can modify or add to the formulas that appear in the Formula Listing menu.
In the following example, we will write a generic formula (one that can be used with any symbol) for an instrument’s average true range over 10 periods.
To enter a new formula in the Formula Listing menu, follow these steps:
| Do not tap the |
Modifying an Existing Formula Top of Page
To modify an existing formula in the Formula Listing menu, begin by locating the formula (this may require you to use the up and down arrows at the bottom of the Formula Listing menu). Highlight the formula to be modified and either single click left on it with the mouse, or press
Formula Variations
In addition to the previous example, formulas maybe written in other styles, including the following:
Embedded Formulas Top of Pagerange_form=(AvgTrueRange($1)+$1.recent)/2
This shows how a previously defined formula called AvgTrueRange can be used, or embedded, in another formula (in this case, it is embedded in a formula called range_form).
avg_volume=($1.volume+$1.volume[1]+$1.volume[2])/3
This shows how a past value can be used in a formula using the square brackets [ ]. Within the brackets, type the desired number of bars back that you want to use in the calculation. [1] is the value one bar back, [2] is the value two bars back, etc.
Self-Referencing Formulas
Top of PagevolAccumulator=$1.volume+volAccumulator[1]
This shows how a formula can make reference to itself. In this case, the current volume is added to the formula’s previous value.
Formulas to be Charted (Custom Indicators)
Top of PageMidTickAvg(input)=eavg($1.avgtick,14) Overlay
MFI_(series)=($1.high-$1.low)/$1.volume Study
These are examples of formulas you intend to chart, or custom indicators.
When you bring up a Graph Menu and select Study, you’ll notice that there are two categories of indicators: Overlays and Studies.
Overlays are indicators which share the same scale as the price data. Moving averages are a good example of an overlay indicator. It makes sense to "overlay" a moving average on a bar chart or candlesticks because its values are related and very close to the price data.
Studies refer to the group of indicators which have their own scale. Volume is a good example of such an indicator. An instrument’s volume is usually very different from its price, as in the case of an equity which trades in the $17 to $18 price range and has a volume of several hundred thousand shares. If the active window on your screen contains a chart and you select Volume from the Select Study menu, the volume study will not overlay, but replace the price data.
| Aspen Graphics allows you to write you own indicators, and it's no more difficult than writing a formula. |
You write your indicator as a formula in the Formula Listing, just as we’ve done previously. You only have to specify one more thing, and that’s whether you intend your indicator to be viewed as an overlay or a study.
If you want your indicator to be viewed as an overlay, insert the word input in parenthesis after the formula’s name, as in this example:
MidTickAvg(input)=eavg($1.avgtick,14)
If you want your indicator to be viewed as a study, insert the word series in parenthesis after the formula’s name, as in this example:
MFI_(series)=($1.high-$1.low)/$1.volume
Studies-on-Studies
Top of PageRSI_Momentum(series)=rsi(mom($1,1),3)
This shows how a formula can be written so that a study is performed on another study. In the previous example, a three-period RSI is performed on a one-period Momentum study.
Many of the studies which come with Aspen Graphics can be performed on other studies without having to write a special formula. For more
information on Studies-on-Studies, see the Study chapter of this manual.
Displaying a Formula on a Chart
Top of PageTo chart a formula, follow these steps:
| If the formula was written using the $1 variable, you need to specify the
name of the formula AND the instrument to be used in place of the variable. For
example: My_Formula(ibm) and press |
If the formula contains an (input) or a (series), follow these steps to chart it:
Displaying a Formula in a Quote Window
Top of Page You can quote the value of a formula by formatting the name of the formula in a quote window. For instructions on how to format a quote window, see the Quotes chapter of this manual.Some examples of formatting a formula in a quote window are shown in Table 10.
If the formula looks like this in the Formula Listing menu: |
It should be formatted like this in a Quote window: |
Because. . . |
| weekhigh= chart(ibm.high,7,2,100,1,1) |
weekhigh | All the information necessary to calculate the formula is present; there are no variables. |
| Pchg=($1.recent-$1.prev)/$1.prev*100 | pchg($1) | The $1 is a variable, holding the place for an instrument that will be specified later. |
| SPREAD=$1-$2 | SPREAD($1,$2) | There are two variables in the formula, so we leave room for the two variables we’ll be specifying later. |
| Some formulas require the chart function chart( ) when being formatted in a quote window | ||
| 21DayHi=rmax ($1.high,21) | Chart(21DayHi($1) [-1],1,2,100,1,1) |
The formula needs the same frame of reference as a chart. This is supplied by the chart( ) function. |
Table 10
Color Rules Top of PageBy default, the bars in Aspen Graphics charts are yellow. In addition to being able to change the color of the bars from the Bar Chart parameter menu, Aspen Graphics has a Color Rule capability. Color rules act as a visual alarm on a bar chart coloring certain bars which meet user-defined criteria. For example, a color rule can be written so that each bar that hits a 21-day high will be colored red, while all other bars will remain yellow.
Edit a Color Rule Top of PageTo edit a color rule already entered in Aspen Graphics, follow these steps:

Figure 2
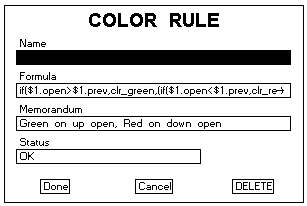
Figure 3
Write a custom Color Rule Top of Page
To write a new color rule, follow these steps:
Table 11 describes what is to be entered in each of the four fields on the color rule edit box.
| Field | Function |
| Name | A unique name for the color rule must be entered in this field. This is one of the few instances where spaces can be used in the name. Up to 39 characters can be used for the color rule name. |
| Formula | The condition for the color rule must be entered here, using formula language. Color rules are limited to 255 characters. |
| Memorandum (optional) | Allows the user to enter a description of the color rule. Up to 39 characters may be entered in the Memorandum field. |
| Status | This field is not editable; it displays information about the color rule. If the syntax of your formula is correct, the status field will display OK. If an error has been made in writing the color rule, an error message will be displayed. |
| Done | Adds the color rule to memory and displays the Color Rule menu. |
| Cancel | Aborts the color rule; it is not saved in memory. |
| DELETE | Deletes the selected color rule from memory. |
Table 11
Color Rule Example Top of PageThe following steps will take you through the process of writing a generic color rule.
This color rule alerts you when the current bar of the charted instrument has
increased 5% from the previous bar, using the pchg formula already entered
in the Formula Listing. To write a color rule for this condition, follow these steps:
From the Graph Menu, select Color Rules. From this menu, select Add Color
Rule.
Single left click under Name. Type in 5% Gain, and tap
| Color rules are not case sensitive; upper and lower case letters can be used interchangeably. Using both upper and lower case letters in the name can make it easier to read from the Color Rules menu. |
| This formula will color any bar on the chart green where the percent change from the previous bar was above 5%. The rest of the bars on the chart will be colored red. The $1 variable was used so that the color rule could be applied to any instrument that is displayed in the chart. |
Once a color rule has been written, an additional step must be taken to activate it on a chart. To display a color rule on the chart, follow these steps:
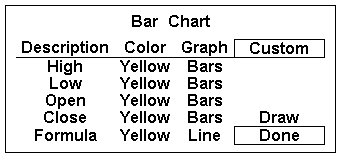
Figure 4
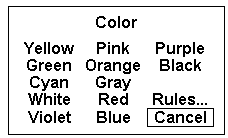
Figure 5
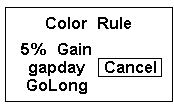
Figure 6
When you edit an active color rule, the changes will take effect immediately on any chart on which that color rule is active.
When a color rule is activated on a chart and the cursor window is displayed, the High price in the cursor window will be drawn in the same color as the bar.
Other data listed in the cursor window can be displayed in different colors using color rules. Although a color rule enacted on a value other than the High price will change the color of that price in the cursor window, the color of the bar itself will only be controlled by the color or color rule selected for the High price in the Bar Chart parameter menu.
Writing A Color Rule For A Specific Symbol Top of PageColor rules can be written either generically or specifically. The 5% Gain color rule in the previous example is generic; it will calculate on any instrument displayed on the chart. Replacing $1 with an instrument (i.e. SPH7) would calculate the color rule using that instrument, regardless of the data displayed in the bar chart. For example, the 5% Gain formula could be written as:
if(pchg(sph7)>5,clr_green,clr_red)
Written this way, IBM could be displayed in the bar chart and the bars of the chart will be colored based on the percent change of sph7.
| If you define a specific symbol in your color rule, it will only calculate your formula for that symbol, regardless of what symbol is displayed in the chart. |
Using Color Rules To Color Studies
Top of PageColor rules can be displayed on studies as well as price data. When using color rules to color study values, there are two options. If you want the color rule to evaluate data based upon the values of the study, use the $1 convention. For example, to be alerted when the slope of the study is rising, enter the following in he formula field:
if($1>$1[1],clr_green,clr_red)
| Using the $1 variable in place of a symbol in this formula allows you to use this color rule on either a bar chart (where it will monitor rising values of price data) or a study (where it will monitor the study values). |
To color your STUDY based upon data of the underlying, RAWDATA must be used instead of $1. For example, if we wanted to be alerted when the instrument’s price is rising or falling, regardless of the study value displayed on the chart, enter the following formula:
if(rawdata>rawdata[1],clr_green,clr_red)
With a study displayed in a chart, activate the color rule by bringing up a Graph Menu and selecting Parameters. Click on the color displayed in the Color field, select Rules…, then select the color rule you previously entered. Clicking on Draw or Done will display your color rule on the study.
Using Number Codes For Colors In A Color Rule
Top of PageIn very lengthy color rule formulas, replacing the number codes for the colors can save valuable space. (Color rule formulas are limited to 255 characters). Number equivalents to system colors are listed in Table 12.
COLOR |
NUMBER |
| Yellow | 0 |
| Green | 1 |
| Cyan | 2 |
| White | 3 |
| Violet | 4 |
| Pink | 5 |
| Orange | 6 |
| Gray | 7 |
| Red | 8 |
| Blue | 9 |
| Purple | 10 |
| Black | 11 |
Table 12
The 5% Gain formula, using number codes in place of the colors, would be written the following way:
if(pchg($1)>5,1,8)
Coloring Specific Prices
Top of PageColor rules can be used to color a specific price on the bar chart. For example, to set 5% Gain to the Low price, follow these steps:
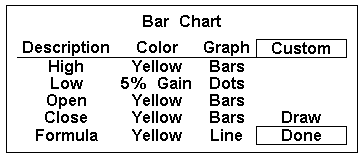
Figure 7
Alarms
Aspen Graphics’ alarm feature enables you to monitor and be instantly alerted to criteria which you define. These criteria include the following:
Times & Dates
Functions
Formulas
Mathematical expressions
| Alarms cannot monitor Trendlines or News stories. |
The Alarms Menu (see Figure 8) allows you to modify existing alarms or to create new ones. To display the alarms menu, type .alarm
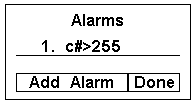
Figure 8
Initially, the Alarms menu will be empty. After you create an alarm, it will be listed on this menu.
To modify an existing alarm, single left click on the alarm. When an alarm is selected, it will bring up the Add or Edit an Alarm setup window containing that alarm.
To write a new alarm, single left click on Add Alarm. When Add Alarm is selected from the alarm menu, the Alarm Setup window (Figure 9) will be displayed:
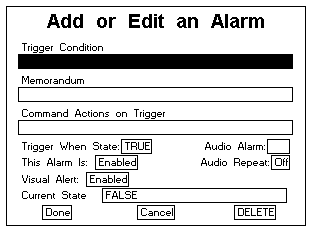
Figure 9
Elements of the Alarm Setup Window
Top of PageField |
Function |
Examples |
| Trigger Condition | Specifies the condition about which you want to be alerted. | Spm7==765 ck7.recent-cn7.recent>4 |
| Memoran-dum | Enables you to enter a description or message about the alarm. | Positive cci value SELL!! |
| Command Actions on Trigger | Enables you to assign a command or string of commands to be enacted when the alarm is triggered. | My_Page;\wn7;.print Cht_1;sp#;.mav |
| Trigger When State: | Enables you to toggle through the three trigger condition states which will set off the alarm. | True: Alert when Trigger Condition is
true. False: Alert when Trigger Condition is false. Changes: Alert when Condition changes. |
| Audio Alarm: | If a sound card is installed in your system, it enables you to specify one of the preset audio alarms or to assign custom .wav files to the alert. | For information about assigning a .wav file to an alarm, see "Setting an Audio Alarm" later in this chapter. |
| This Alarm is: | Enables you to activate the alarm or to keep the alarm in memory but render it inactive. | Enabled: Alarm will activate when
Trigger Condition is met. Disabled: Alarm is not active; Aspen Graphics will not be monitoring the Trigger Condition. |
| Audio Repeat: | Enables you to repeat the audio alarm. | On: Will repeat the audio alarm every
10 seconds until the alarm is turned off. Off: Audio alarm will only sound once. |
| Visual Alert: | Enables you to toggle the visual alarm window on or off. | On: The alarm window will be displayed
at the bottom of the screen when the alarm is triggered. Off: The alarm window will NOT be displayed when the alarm is triggered. |
| Current State: | Non-editable field; displays whether the Trigger Condition is currently true or false. Also will display an error message if the alarm has not been written syntactically correct. | True: Trigger Condition criteria is
true at this time. False: Trigger Condition criteria is NOT true. Null Value: Trigger condition is lacking necessary parameters to evaluate the condition. Syntax Error: Syntax error in writing the Trigger Condition. |
| Done | Saves the alarm & returns you to the Alarms Menu. | A single left click on Done will save all information contained in the setup window. |
| Cancel | Exits the Alarm setup window without saving changes & returns to the Alarms menu. | Single left click on Cancel to return to the Alarms menu. |
| Delete | Deletes the alarm from memory and returns to the Alarms menu. | Protected selection. Double left click to delete the alarm. |
Table 13
Defining a Trigger Condition
The first step in writing an alarm is establishing the Trigger Condition. To enter a Trigger Condition, single left click in the Trigger Condition field; an edit box will be displayed.
There are six types of criteria that can be entered in this field. The following sections include definitions and examples of these.
Instrument Symbols and Prices Top of PageYou can set an alarm on any instrument that is defined in your system. The Trigger Condition needs to reference a specific instrument; using the $1 variable will return an error message in the Current State field.
Examples: |
When you will be alerted: |
ibm==137 |
When the price of IBM reaches 137 |
Table 14
Times
Top of PageAlarms can be written to alert you to a specific time. These trigger conditions need to be written in HH:MM format, using 24-hour notation.
| Examples: | When you will be alerted |
| time>=9:00 | on or after 9:00 a.m. |
| time==15:45 | at 3:45 p.m. |
Table 15
Dates Top of PageDates used in trigger conditions need to be stated in mm/dd/yy format. Dates can be combined with times using the and operator.
Examples: |
When you will be alerted |
date==4/15/97 |
on April 15, 1997 |
date>=1/1/98 |
on or after Jan 1, 1998 |
date==6/1/97 and time==14:00 |
on June 1, 1997 at 2:00 p.m. |
Table 16
Aspen Graphics’ date math capabilities make it possible to create alarms that tell you when it is a certain number of days before a future’s or option’s expiration date.
Examples: |
When you will be alerted |
date==ck300c.expire-3 |
three days before expiration |
date==spu7.expire |
expiration day |
date<=dmm7.expire-2 |
two days before expiration |
Table 17
Formulas Top of PageAny formula defined in your Formula Listing menu can be referenced in the Trigger Condition of an alarm. If the formula was written using the $1variable, you must include the symbol in the trigger condition.
Examples: |
When you will be alerted |
spread(ck7,cn7)>=0 |
when the spread value is positive |
chart(slowk(sp#,9)>=slowd(sp#,9)[-1],1,2,100,0,1) |
when the %K line is above %D line |
Table 18
| If you are setting an alarm on a formula which requires other parameters in addition to an instrument, you must use the chart function around the formula. |
An alarm can be set to monitor any Aspen Graphics function. For a complete list of functions, see the Formulas section of this manual.
Examples: |
When you will be alerted |
chart((mom(sp#,10)>mom(sp#,10)[1] and mom(sp#,10)[1]>mom(sp#,10)[2])[-1],1,2,100,1,3) |
when momentum is increasing over the last 2 bars |
chart((rsi(ck7,14)>70 or rsi(ck7,14)<30) [-1],30,1,100,1,3) |
when the RSI is above or below 30 |
Table 19
| If you are setting an alarm on a function which requires parameters in addition to an instrument, you need to use the chart function. |
You can write a mathematical expression as a condition for an alarm. An expression can employ any of the operators in Table 20.
| Operator | Name |
Example |
^ |
Exponentiation | kc#^2 |
- |
Negative | -2*(ibm.last) |
+ |
Positive | +spz7 |
* |
Multiplication | 42*(ho#)-cl# |
/ |
Division | ibm/indu |
+ |
Addition | ck7+cn7 |
- |
Subtraction | cc#-cc#1 |
== |
Equals | intc==131 |
>= |
Greater than or equal to | kw#>=470 |
<= |
Less than or equal to | time<=14:00 |
!= |
Does not equal | date!=1/1/98 |
> |
Greater than | gcm7>gcz7 |
< |
Less than | ok7<175 |
| A space must be used before and after the next two operators when using them in a formula. | ||
AND |
Evaluates both trigger conditions. Alerts only when both conditions are met. | ck7.high<=300 and cn7.high>=300 |
OR |
Evaluates both trigger conditions. Alerts when either condition is met. | time==9:45 or time==13:10 |
| If the "Trigger When State" matches the "Current State" in the Alarm Setup Window, your alarm will be triggered as soon as you select Done. This allows you to test your alarm after creating it to ensure that it is evaluating your criteria properly. |
When an alarm is triggered, an alarm window is displayed across the bottom of the screen (if you have enabled the Visual Alert). The alarm window will include the date & time the alarm was triggered, the state of the trigger condition (T=true, F=false), the trigger condition, a memorandum (if you entered a message in the Memorandum field) and directions for removing the alarm window from the screen.
![]()
Figure 10
If more than one alarm is triggered before the alarm window is cleared off the screen, they will be stacked on top of one another. The number of alarms that can be displayed at one time depends on the font size settings; the smaller the font size, the more alarms that can be displayed simultaneously.

Figure 11
Resizing and Moving the Alarm Window
Top of PageYou can resize and move the alarm window just as you would any other Aspen Window (see the Aspen Windows section for more information). Once you move or resize the alarm window, it will remain in that state until you exit and reenter the program.
Removing the Alarm Window
The keyboard command to remove the alarm window from the screen depends upon the type of operating system you have. On DOS systems, tapping
The Command Actions on Trigger feature allow you to assign any Aspen Graphics command to be enacted when your alarm is triggered (for a list of all Aspen commands, see the Appendix of this manual). For example, if you have written an alarm to trigger when the price of May corn goes above 305 and you would like to print your favorite page (called My_Page) when your alarm is triggered, enter the following in the Command Actions on Trigger field:
![]()
Figure 12
When your alarm is triggered, My_Page will be displayed on your screen. May corn will be entered into all windows of your page, and the page will be printed.
If you are running the Aspen Graphics for WindowsÒ , the portion of your screen that will be printed when the alarm is triggered depends on the selection in the Object section of the Print Setup box. If Screen is selected, the entire contents of the screen, including the alarm window, will be printed. If Active Window is selected, only the window which was active when the page was saved will be printed.
| If you are running Aspen Graphics for Windows®, and you want to autoprint using this method, make sure that Print Preview (found in the Print Setup box) is not selected. If Print Preview is selected, the system will wait for you to approve the print job before it is printed. |
The Audio Alarm field enables you to assign a sound sequence to an alarm. Single left clicking in the Audio Alarm field will scroll through the numbers assigned to the audio alarms. Leaving this field blank will only trigger a visual alarm; no audio alarm will accompany it.
If your computer is equipped with a sound card, you have access to up to 99 audio alarms. Using the Windows® audio recorder, you can record a custom message and assign it to an alarm. The Windows® audio recorder creates .WAV files. To create a .WAV file for use in an Aspen alarm, record a message, and name the file using the convention ALARM<integer>.WAV. Examples of names for your .WAV files are:
Alarm1.wav
Alarm23.wav
Alarm89.wav
Up to 99 unique .WAV files can be saved and applied to the Aspen alarm function. Save the .WAV files to the \apex directory on the drive out of which you run Aspen Graphics for WindowsÒ .
To assign a .WAV file to an alarm, left click in the Audio Alarm field until the integer which corresponds to the name of the .WAV file is displayed. For instance, if the file is named Alarm16.wav, scroll through the numbers in the Audio Alarm field until the number 16 appears. When the alarm is triggered, that custom recording will sound.
Alarms on Instruments Quoted in Fractions
Top of PageSome equities and commodities are quoted in fractional numbers, i.e. U.S. Bonds are quoted in thirty-seconds and grain options are traded in eighths. To set alarms based on fractional prices, use the following syntax:
| Syntax | Meaning |
|
| Specifies eighths. To enter a
price in the trigger condition in eighths, (for example, sx600c==29 3/8
) type in sx600c==29 |
||
| Specifies thirty-seconds. To enter
a price in the trigger condition quoted in 32’s, (i.e. us#>=107 26/32),
type in us#>=107 |
||
| Specifies half- and quarter-thirty-seconds. See the following section on Half and Quarter Thirty Seconds. | ||
Table 21
| To indicate a single digit numerator for 32’s, you must preface it with a zero. For example: us#==107 3/32 would be entered us#==107’03. A price of less than one also needs a zero. 14/32’s would be entered as: 0’14. |
Half- and Quarter-Thirty-Seconds
Top of PageTo enter a trigger condition based on half-thirty seconds, follow these steps:
This will produce one of two conclusions:
The fraction reduces to an even number. For example, you want to set an alarm to
alert you when the five-year note hits 104 28/64. This fraction
reduces to 14/32. The Trigger Condition should be written as:
fv#==104’14
The fraction does not reduce evenly. For example, you want to be alerted when it hits 10443/64. This trigger condition should be entered as: fv#==104’214
104 represents the whole-number portion of the price.
‘21 represents the reduced numerator (43/64 reduces to 21.5/32).
4 represents the multiplier 4/8, converting the fraction to half-thirty-seconds.
Reduce the fraction to thirty-seconds.
If it reduces evenly, follow the step in the previous section.
If the fraction does not reduce evenly, follow these steps:
For example, you want to use tu#==10253/128 as the Trigger Condition. It would be entered as:
tu#==102’132
Cloning Alarms using the F12 Key Top of Page102 represents the whole-number portion of the price.
13 represents the reduced numerator (53/128 reduces to 131/4 thirty-seconds).
2 represents the multiplier 2/8, converting the price to quarter-thirty-seconds.
At times, you may need to set the same alarm for a number of different instruments. The most efficient way to duplicate the alarm is by using the F12 key. To clone an alarm, follow these steps: