


Coloring Bar Charts
When coloring bar charts, each bar is drawn in only one color, which is the color defined by the first (
“High”) color parameter in the bar chart parameter dialog box. However, all four color parameters are used individually for coloring entries in cursor windows and table windows associated with the chart window. For example, you can select a separate rule for coloring the “Close” line of the cursor or table window. The following pages describe the application of color rules in more detail. Once you define a color rule, it is available to you through the parameters menu of any bar chart. To display a parameters menu, select Parameters from the Graph Menu. This displays the Edit Studies menu:

When the Edit Studies menu appears, select Bar Chart. This displays the parameters menu for the current bar chart:
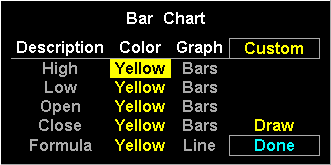
The color definition for a bar
’s high price governs the color of the bar. By default, all bars are colored yellow. To apply a color rule, select the color definition for the bar’s high price. This displays the color menu: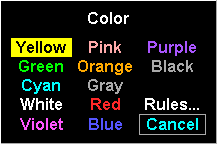
The color menu contains thirteen selections:
Selection
| Function
|
Yellow
| Renders the bar yellow.
|
Green
| Renders the bar green.
|
Cyan
| Renders the bar cyan.
|
White
| Renders the bar white.
|
Violet
| Renders the bar violet.
|
Pink
| Renders the bar pink.
|
Orange
| Renders the bar orange.
|
Gray
| Renders the bar gray.
|
Red
| Renders the bar red.
|
Blue
| Renders the bar blue
|
Purple
| Renders the bar purple
|
Black
| Renders the bar black.
|
Rules...
| Displays the Color Rule menu.
|
Cancel
| Returns you to the Color menu.
|
To assign a color rule to a bar, select Rules... This displays the Color Rule menu (not to be mistaken for the other Color Rule menu):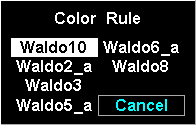
The Color Rule menu contains defined color rules. To finish the assignment of a color rule, select the rule you want. Selecting a color rule returns you to the Bar Chart parameters menu and activates the color rule you selected for the high price:
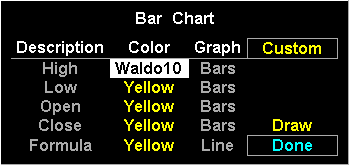
To use the color rule, select Draw or Done.
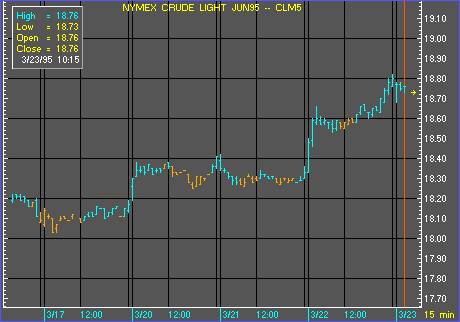
Although you cannot see colors in the figure above, the chart has been drawn using a color rule. Not only are the bars drawn according to the color rule, but the cursor display window also renders bar information based on the color rule. For example, if a color rule compares the current high to the high 5 bars ago and renders bars in cyan if the current high is greater, placing the cursor on a cyan bar causes the cursor display window to render the word
“High,” the equal sign (=) and the high price in cyan.


