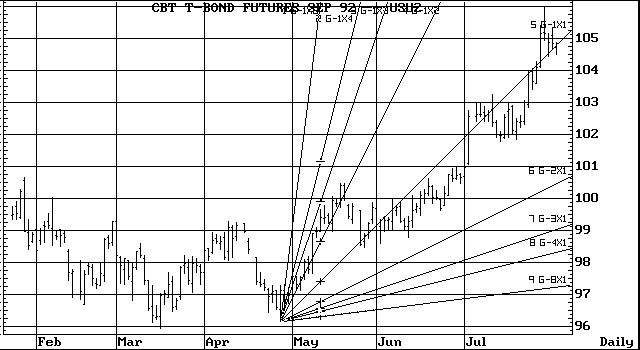
The Gann Time/Price function enables you to display a Gann fan based on settings you define in the Gann Square Options menu. W. D. Gann used price and time to forecast market turns. First, a market high is identified. The dollar amount of the high is converted into a calendar unit (i.e., days, weeks, months, or years). The calendar unit is projected forward to identify dates on which market turns may occur. To draw Gann Time/Price angles, follow these steps: 1. Choose Gann Time/Price on the Trendlines Menu. 2. Move the trend line cursor to the significant high or low origination point for the Gann Time /Price angle or angles and click on the left mouse key. The trend line cursor changes to a pencil. 3. Hold down the right mouse key and drag the mouse to the next significant point to draw the base line for the Gann Time/Price angles. 4. Click the left mouse key. The system renders Gann angles according to the specifications you set in the Gann Square Options menu.Gann Time/Price Angles