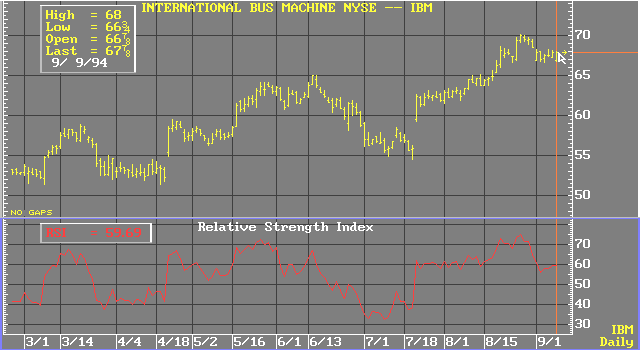
Relative Strength Index (RSI)
The Relative Strength Index is an overbought/oversold indicator plotted on a vertical scale from 0 to 100. Developed by J. Welles Wilder, the RSI originally employed a fourteen-period calculation. Wilder considered RSI values under 30 as oversold conditions, and RSI values over 70 as overbought conditions. Now, five-to fourteen-period calculations are commonly applied, depending on the market, and 80 and 20 are often used to delineate overbought and oversold conditions, respectively.
Formula:
![]()
![]()
You change the number of periods used to calculate the RSI in the RSI Parameters menu. A low number of periods yields frequent buy and sell signals. A high number of periods yields fewer buy and sell signals.

see, J. Welles Wilder Jr., New Concepts in Technical Trading Systems, McLeansville, NC: Trend Research, 1978, pp. 63-70
See also:Relative Strength Index Function