Transparent Charts
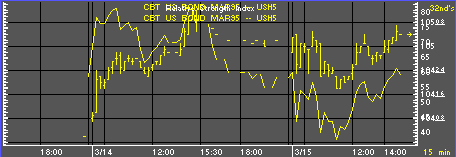
Transparent charts and/or studies are the primary use of transparent windows. When you select a transparent chart, the system displays charts, scales, and text are displayed with no background. When a transparent chart is placed over another chart, the underlying window remains visible and the contents of both can be easily compared. Possible uses of transparent charts:
![]() Overlaying studies on charts (see, below)
Overlaying studies on charts (see, below)
![]() Overlaying studies on studies
Overlaying studies on studies
![]() Overlaying charts on charts
Overlaying charts on charts
![]() Overlaying charts of the same instrument at different times (e.g., USH3 before 1/1/89 and USH3 before 1/1/88)
Overlaying charts of the same instrument at different times (e.g., USH3 before 1/1/89 and USH3 before 1/1/88)
![]() Overlaying news on charts
Overlaying news on charts
![]() Overlaying quotes on charts.
Overlaying quotes on charts.
