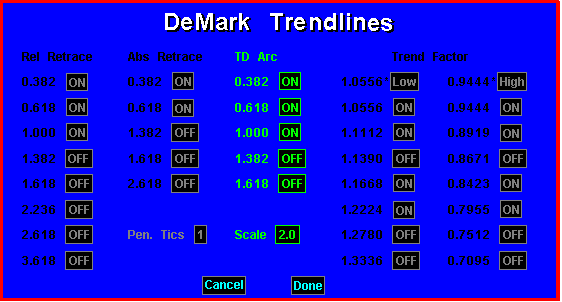
The TD Retracement Arc study also has Date and Time parameters, which identify the date and time of the reference bar. As with any trend line drawing function, the process of drawing a TD Retracement Arc study involves selecting a reference bar, and selection specifies the Date and Time parameters.
TD Retracement Arc draws elliptical trendline curves. The anchor point and magnet price are determined in the same way as for Relative Retracement. Also, the software calculates the distance (number of bars) from the anchor bar to the high or low bar whose close determines the magnet price. Then, the trendline curve for fraction F is a segment of a quarter ellipse starting horizontally at the anchor point, and ending vertically at price:
The trendline curve terminates early if it touches a price bar before reaching the end point.