![]()
![]()
|
|
|
|
The average directional movement index is designed for use with the directional movement index.
Although Aspen Graphics enables the time parameters of the ADX to be set independently of the DMI, the parameters of both studies can be adjusted so they work in tandem.
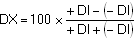
Calculating ADX is a two-step process. First, the difference of +DI and -DI is divided by the sum of +DI and -DI, and the quotient is multiplied by 100; the result is known as DX. Second, ADX is calculated by taking a modified moving average of DX.
Keyboard Shortcut: .ADX
Formula:
ADX = modified moving average of DX
Where:
n = number of periods
+DI = current positive directional index
-DI = current negative directional index
DX = current DX
The ADX fluctuates between 0 and 100, with the higher values reflecting stronger trends.
|
Parameter |
Function | ||||||||||||||
|
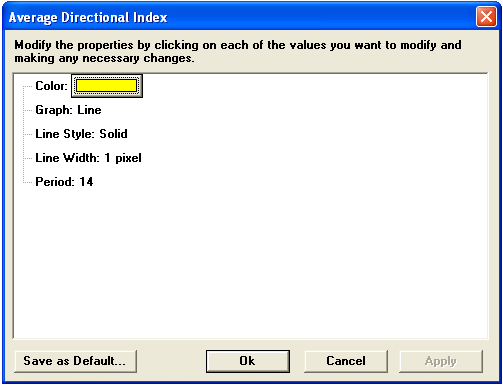
Color |
Default color is Yellow. To change the color, click on the color button:
Then choose the color you want from the Color Menu.
| ||||||||||||||
|
Graph |
Sets the drawing method for the study.
| ||||||||||||||
|
Line Style |
Sets the rendering technique of the graph parameter (if it is set to Line).
| ||||||||||||||
|
Line Width |
Sets the tickness of the study line.
| ||||||||||||||
|
Period |
Default is 14 |
Notes
J. Welles Wilder Jr. developed the Average Directional Index (ADX) to measure trend strength. It is important to detemine whether the market is trending or plaining (moving sideways), for ADX interpretation depends on what a market is doing.
ADX is an oscillator that fluctuates between 0 and 100. Even though the scale is from 0 to 100, readings above 60 are relatively rare. Low readings below 20 indicate trend weakness while high readings above 40 indicate a trend strength. (Given these levels, you can consider the ADX a banded oscillator.) The indicator does not grade a trend as bullish or bearish, but merely assesses a trend's strength. A reading above 40 can indicate a strong downtrend as well as a strong uptrend.
ADX is also useful to identify when a market is abandoning or commencing a trend. When ADX begins to strengthen by crossing from below 20 to above 20, a trading plain may be giving way to a trend. Make it a habit to look for confirmation by other indicators.
ADX is derived from two other indicators, also developed by Wilder, +DI and the -DI. See, Directional Indicator.
see, J. Welles Wilder Jr., New Concepts in Technical Trading Systems, McLeansville, NC: Trend Research, 1978, pp. 35-52.

