![]()
![]()
|
|
|
|
The directional movement index was developed by J. Welles Wilder for identifying whether a market is in trend mode. In other words, the DMI helps identify whether there is a definable trend in a market, and in which direction that trend is moving.
Formula:
Wilder defines +DI as the percentage of the true range that is up. -DI is the percentage of the true range that is down. According to Wilder, when the +DI value is greater than the -DI, a long position is indicated. Conversely, when the -DI is greater than +DI, a short position is indicated. The DMI can be used alone or with the Average Directional Movement Index (ADX). For more information on ADX, see Average Directional Movement Index.
|
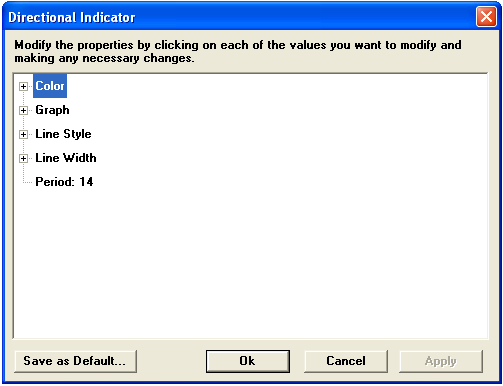
Parameter |
Function | ||||||||||||||
|
Color |
Default color for -DI is yellow; default color for +DI is green. To change the color, click on the color button:
Then choose the color you want from the Color Menu.
| ||||||||||||||
|
Graph |
Sets the drawing method for the study.
| ||||||||||||||
|
Line Style |
Sets the rendering technique of the graph parameter (if it is set to Line).
| ||||||||||||||
|
Line Width |
Sets the tickness of the study line.
| ||||||||||||||
|
Period |
Default is 14 |
Notes
The Directional Indicator is traditionally assessed beside the Average Directional Index (ADX). The Directional Indicator and ADX compliment each other in a remarkable way.
The Directional Indicator's +DI value represents a market's bullish force, and its -DI value represents a market's bearish force.
Directional Indicator signals are generated when +DI crosses -DI, or vice versa (the higher value being the dominant force). Caution should be given to literal application of this principle, for whipsaw activity is common in non-trending markets. A bullish signal occurs when +DI moves above -DI, and a bearish signal occurs when -DI moves above the +DI. +DI/-DI crosses should be confirmed by other indicators.

J. Welles Wilder Jr. confirmed this study with the ADX , which identifies trend strength. The ADX combines +DI and -DI values and then smoothes the lot in a moving average. The result is trend strength (regardless of trend direction). Generally, ADX readings above 40 indicate a strong trend while readings below 20 indicate a weak trend.
see, J. Welles Wilder Jr., New Concepts in Technical Trading Systems, McLeansville, NC: Trend Research, 1978, pp. 35-52.

