Creating Slaves
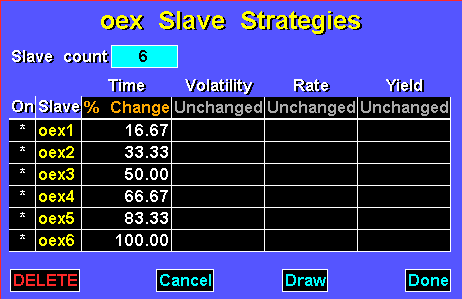
Before you create slaves, you need to decide how many slave strategies you want. By default, you get two slave strategies. You can specify up to twelve. To specify a number of slave strategies greater than two, display the Slave Strategies menu and open the Slave Count field. Then, enter the number of slave strategies you want. Specifying a number other than two expands the slave strategy table, creating the number of records you enter. For example, if you enter the number six, the slave strategy menu creates six records, one for each slave strategy:
For all pricing model variables, the following gradation types are available:
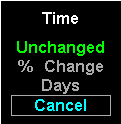
Unchanged (no gradation)
% Change from the current value (default; gradation created by dividing 100% by the number of slaves selected)
Difference from the current value (difference in days for time).
These choices are available through menus displayed when you select a displayed gradation type in the table.
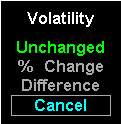
Once you make a gradation type selection, the Slave Strategies menu automatically produces default gradation levels. However, you are not bound by the default gradations. If you want to change a gradation for any slave, position the mouse pointer on top of the gradation you want to change and click the left mouse key. This displays the gradation value in an edit box. To change the value, type an alternate value and press
b.
For example, to create slave strategies that show time decay on a percent change basis and volatility increase as expiration approaches on an absolute difference basis, you would set the table up as follows:
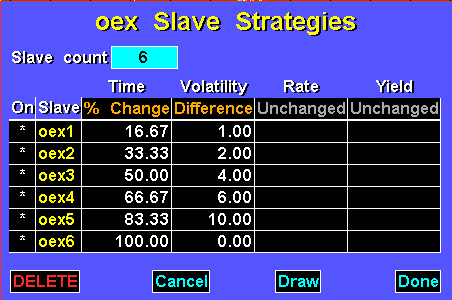
This table creates strategy OEX1 that has a time to expiration that is 16.67 percent less than the actual time to expiration. Furthermore, OEX1
’s volatility is increased by one point (if OEX’s current volatility is 10, OEX1’s is 11). The rest of the slave strategies are adjusted similarly.
Creating slave strategies has two effects. First, it renders more lines on your options chart. Second, it creates slave strategy menus for each slave strategy. Let
’s look at these two effects more closely.
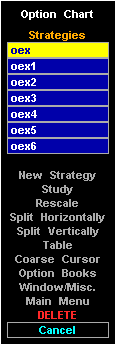
As a result of creating six slave strategies, you option chart would display six strategies:
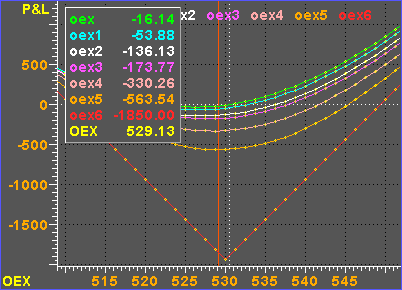
The master strategy is colored green. Slave strategies are colored using unique colors. Use the cursor window and the option chart labels at the top of the window to identify the color of each strategy.
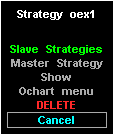
Additionally, the content of the Strategy menu changes as follows:
