

Option Chart Studies
The Ochart Study menu enables you to select a study. The study menu enables
you to change the X and Y axis metrics. To display the Ochart Study menu, select Study from the Option Chart menu:

The X axis study is the independent variable passed to the options pricing
model; in other words, it is the pricing model parameter that varies across the X
axis while the other pricing model parameters are held constant. The default
study for the X axis is the underlying price.
X Axis Study
| X Axis Metric
| Label
|
Price
| Underlying price (Default)
| <symbol>
|
Time
| Time to expiration
| Days
|
Volatility
| Volatility
| Vlty
|
Rate
| Interest rate
| Rate
|
Frate/Yield
| Foreign currency interest rate or stock dividend yield
| Frate/Yield
|
The Y axis study is the dependent variable that the pricing model calculates
for the whole strategy as the X axis variable, or independent variable, changes.
By default, the Y axis measures total profit and loss. The default units for
the Y axis scale is currency (i.e., Pounds); the scale can be changed to show
points of the underlying. The Y axis can display any of the following studies:
Y Axis Study
| Y Axis Metric
| Label
|
Profit & Loss Total
| Total profit and loss (Default)
| P&L
|
Profit & Loss Today
| Daily profit and loss.
| P&Ld
|
Profit & Loss Market
| Market profit and loss.
| P&Lm
|
Market Value
| Open trade equity.
| Value
|
Delta
| Strategy delta
| Delta
|
Gamma
| Strategy gamma
| Gamma
|
Theta
| Strategy theta
| Theta
|
Vega
| Strategy vega
| Vega
|
Rho
| Strategy rho
| Rho
|
Frho
| Strategy foreign interest rho
| Frho
|
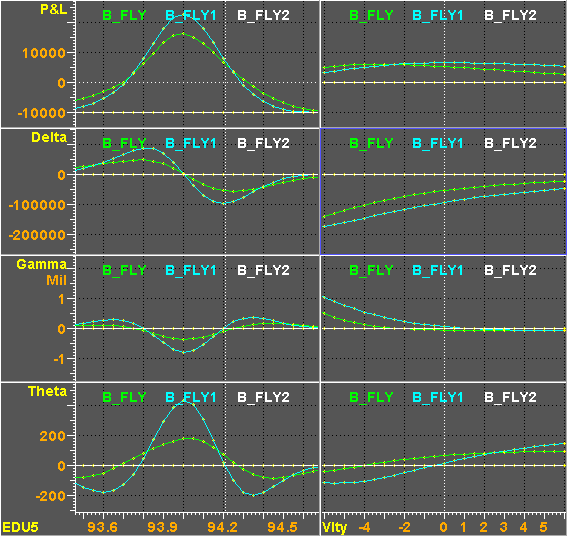
Below we show four Y axis studies (P&L, Delta, Gamma, and Theta) versus two X
axis studies (Price and Volatility) in an option chart that has been split into
eight windows:

For more information on splitting charts, please read Splitting Option Charts.

