Splitting Option Charts
Like chart windows, options chart windows can be split. Splitting enables you to link two or more options chart windows with a common X or Y axis. However, where chart windows can only be split horizontally, options chart windows can be split both horizontally and vertically.
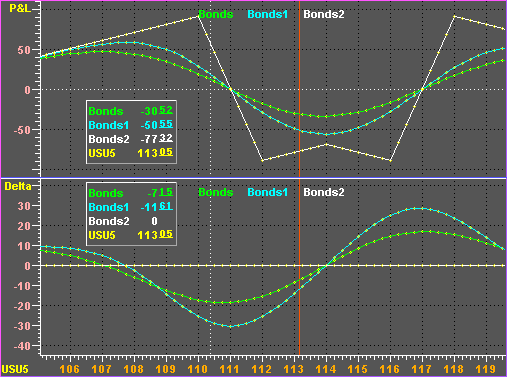
If you have used Aspen before, you are probably familiar with splitting a bar chart in half for displaying a study. The same principles apply to splitting an options chart horizontally. To split an options chart window horizontally, select Split Horizontally from the Option Chart menu. When you split an options chart window horizontally, the X axis is shared by both of the resulting windows.

Here, a strategy
’s profit and loss is displayed in the upper window and its delta is displayed in the bottom window. The X axis is common to both charts, and the live cursor is too.
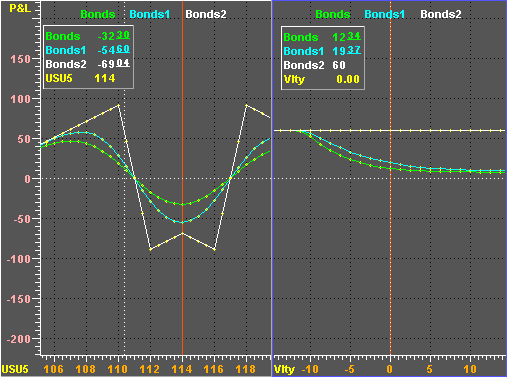
You can also split an options chart window vertically. To split an options chart vertically, choose the Split Vertically selection from the Option Chart menu.

Here, a strategy
’s underlying price occupies the left window, and its volatility is shown in the right window. The Y axis is common to both windows, but each window has its own X axis, and thus its own live cursor.
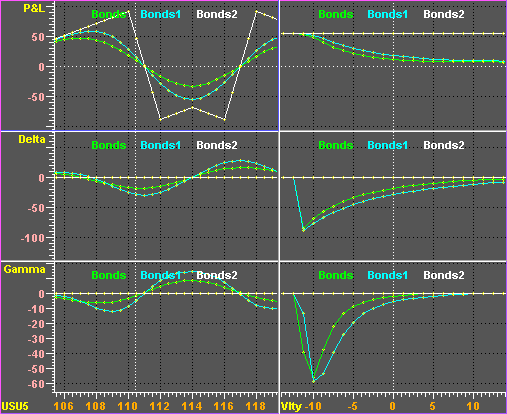
You can also split an options chart both horizontally and vertically:

In the figure above, we have three Y axes and two X axes. Horizontally adjacent charts share a common Y axis while Vertically adjacent charts share a common X axes. Any scaling changes you make to either the X or Y axis affects all windows that share the axis.
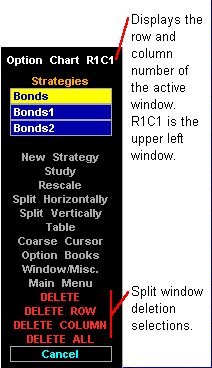
Splitting an options chart causes the Option Chart menu to change. One of the more obvious differences is the menu title. Additional characters indicate which split window is active:

Here, the characters R1C1 identify row 1 column 1 as the active option chart window.
Another difference is the addition of protected selections that provide deletion controls. The number of these selections varies depending on how the chart window is split. A vertical split creates columns and causes a DELETE COLUMN selection to appear. Similarly, a horizontal split creates rows and causes a DELETE ROW selection to appear.
The actions associated with the DELETE ROW and DELETE COLUMN selections are dependent on which window is active. If the active window is R1C1, selecting DELETE COLUMN deletes the first, or left-most, column of split windows; were you to select DELETE ROW, the first, or top-most, row would be deleted.
The DELETE ALL selection deletes the entire options chart.