The Rescaling Menu
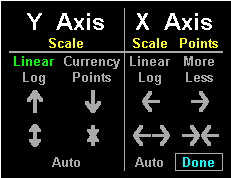
Selecting Rescale from the Option Chart menu displays the rescaling menu:

The rescaling menu contains two groups of scaling options, one group for the Y axis and one for the X axis:
Y Axis Rescaling
Selecting Rescale from the Option Chart menu displays the rescaling menu:
Y Axis Rescaling
The Rescaling Menu

| Selection
| Function
|
| Linear
| Invokes linear Y axis scaling.
|
| Log
| Displays the Y axis using logarithmic scaling.
|
| Currency
| Displays the Y axis in the currency (i.e., dollars) of the option chart’s underlying instrument.
|
| Points
| Displays the Y axis in the points of the option chart’s underlying instrument.
|
|
| Scrolls the chart up the Y axis.
|
|
| Expands the Y axis.
|
|
| Scrolls the chart down the Y axis.
|
|
| Compresses the Y axis.
|
| Auto
| Returns the Y axis to default scaling.
|
| Selection
| Function
|
| Linear
| Invokes linear X axis scaling.
|
| Log
| Displays the X axis using logarithmic scaling.
|
|
| Scrolls the chart left on the X axis.
|
|
| Scrolls the chart right on the X axis.
|
|
| Expands the X axis.
|
|
| Compresses the X axis.
|
| More
| Increases the degree of accuracy by inserting more calculation points per grid
line. The more points per grid line, the more time it takes to calculate
strategy lines.
|
| Less
| Decreases the degree of accuracy by decreasing the number of calculation
points per grid line. The less points per grid line, the less time it takes to
calculate strategy lines.
|
| Auto
| Restores the X axis to default scaling.
|
Some selections in the Rescaling menu causes the X and Y axis scale numbers to change color. The following table summarizes these color shifts.
| Axis
| Color
| Indication
|
| X
| Orange
| Default
|
| X
| Light Blue
| Scale has been shifted, expanded, or compressed, and is locked.
|
| Y
| Orange
| Default (currency)
|
| Y
| Light Red
| Y axis has been set to points.
|
| Y
| Light Blue
| Scale shows currency and has been shifted, expanded, or compressed and is
locked.
|
| Y
| Dark Blue
| Scale shows points and has been shifted, expanded, or compressed and is locked.
|