Option Chart Tables
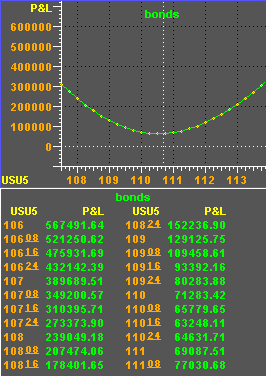
To display the content of an options chart in tabular format, display the Option Chart menu and select Table. When you do this, a window containing a tabular listing of the values in the option chart is displayed:

The table shows two columns, underlying price and profit & loss.
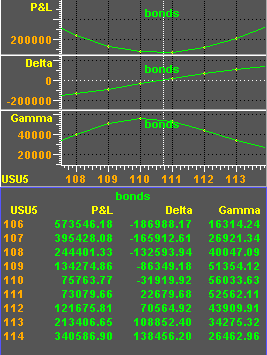
If an option chart has been split horizontally, the table will include all Y axis study values. For example, if the top window is profit and loss, the middle window is Delta, and the bottom window is Gamma, your table shows the underlying price, profit and loss, Delta, and Gamma:

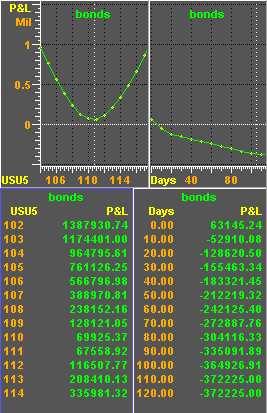
If you split an option chart vertically, each split has its own table because the X axes contain different independent variables. For example, in the following figure, the option chart has been split vertically, and a table has been created for both windows. The table for the first window shows underlying price and profit and loss. The second window
’s table shows time decay in days and profit and loss.
